A new chapter

Formula Bot is now Better Analyst.

Formula Bot began by helping people work faster in spreadsheets. Better Analyst brings the entire analytics workflow into one place—from connecting to, preparing, and enriching data to answering questions, building dashboards, creating reports, and automating recurring data work.

Where we startedFormula BotAI for Excel & spreadsheets
Where we are nowThe all-in-one analytics app

Same account Same work No migration needed

Why the new name

Formula Bot helped you work in Excel. Better Analyst runs the whole data workflow.

Configure how analysis should work, give it trusted business meaning, keep every deliverable on-brand, and put recurring insights on a schedule.

Always up to date

Scheduled dashboards & reports

Save repeatable analysis, refresh connected data, and deliver updated dashboards or reports on the schedule you choose.

  • Run saved analysis daily, weekly, or monthly
  • Analyze fresh data from your connectors on every run
  • Get updated reports delivered to your inbox
Explore Scheduled Tasks

Your way of working

Custom Agents

Save your analysis instructions, Business Context, output preferences, and reference material once—then reuse them everywhere.

  • Begin with the right methods and business knowledge already selected
  • Set answer depth, default deliverable, and Brand Kit per agent
  • Reuse the same analytical approach on the schedule you choose
Explore AI Agents

Consistent by default

Brand Kits

Keep colors, typography, chart palettes, number formats, and artifact styling consistent across every deliverable.

  • The same chart palette across charts, dashboards, reports, and decks
  • Heading and body fonts applied everywhere they render
  • Standard currency, separators, decimals, and negative numbers
Explore Brand Kits

Shared business meaning

Data Context

Give Better Analyst approved definitions for SQL tables, fields, relationships, and business metrics so answers use the language your team trusts.

  • Aliases, descriptions, and roles for every table and field
  • Relationships and metric formulas your team has reviewed
  • Data dictionaries and SQL feedback that steer future queries
Explore Data Context

From source to deliverable

Move the data. Enrich it. Present it.

The work that used to happen across exports, spreadsheet cleanup, and slide decks now happens in one place.

Data FlowsBeta

Raw data in. Ready reports out.

Connect your Google data, shape the exact table in chat, and deliver it to Sheets or your warehouse—on demand or on a schedule.

  • Fresh source data on every run
  • The same filters, joins, and calculated columns, replayed exactly
  • Delivery status and row counts recorded for every run
Explore Data Flows
Pipeline ready
FLOW-04
  1. 01Fresh sources
    GA4
    Search Console
    PostgreSQL
    MySQL
  2. 02Repeatable transform
    Filter rows
    Join sources
    Calculate metrics
    Replays every run
  3. 03Schedule

    Every Monday

    07:30 · EDT

    Active
  4. 04Monitored delivery
    Sheets
    Snowflake
    BigQuery
    SQL Server
    2,418 rowsDelivered

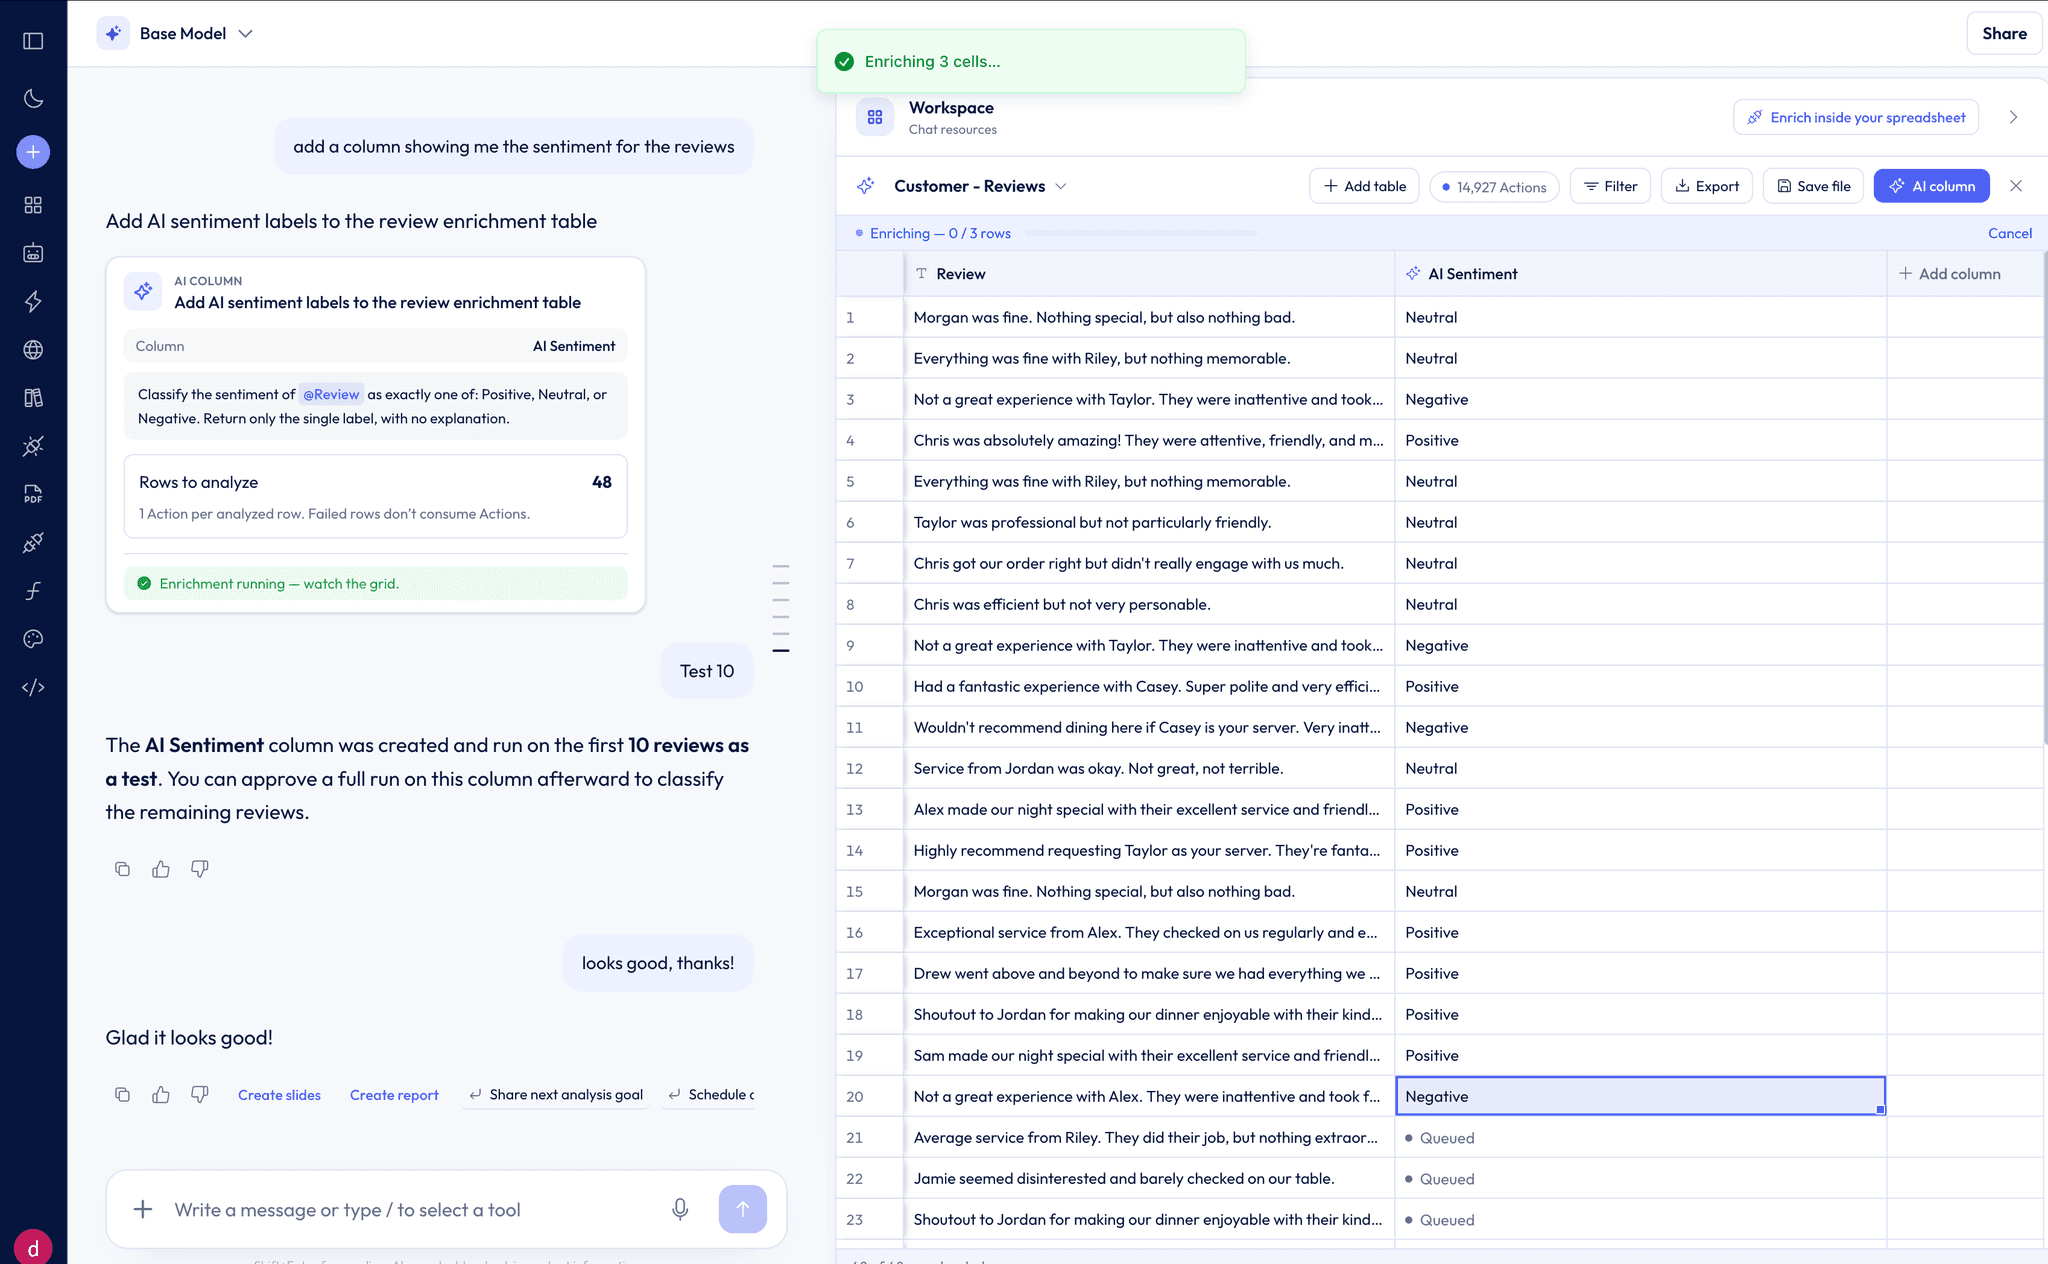
Data Enrichments

Turn messy text into usable data.

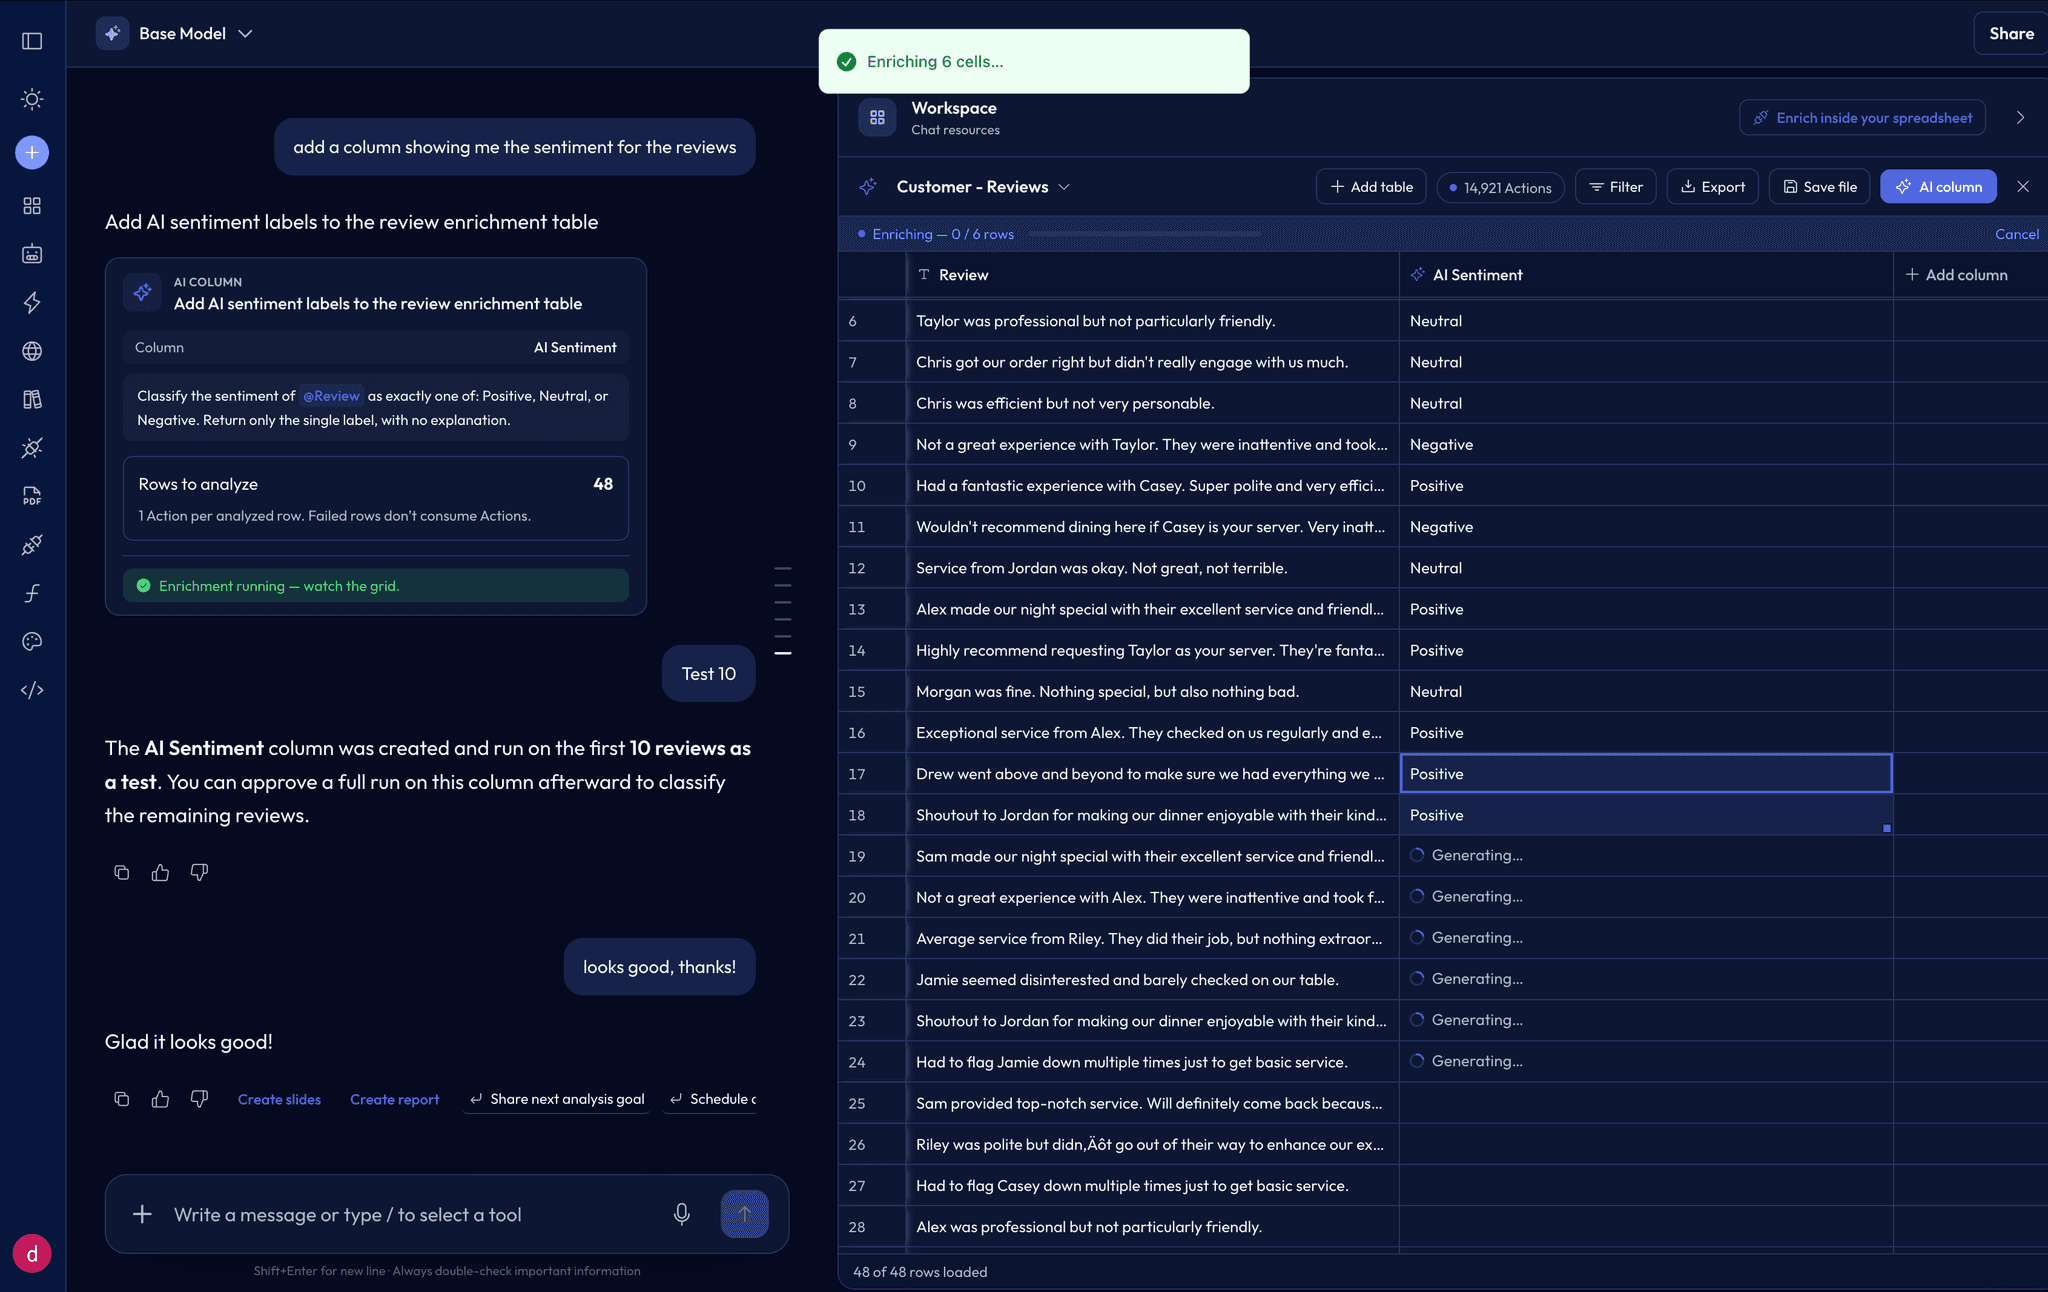
Ask for a new column in plain language. AI adds sentiment scores, extracts entities, and translates text across every row of your table.

  • Sentiment labels for reviews, surveys, and support tickets
  • Keywords, names, and entities pulled into their own columns
  • Test on a sample first, then approve the full run
Explore Data Enrichments
AI Sentiment column being added to a customer reviews table from a chat requestAI Sentiment column being added to a customer reviews table from a chat request

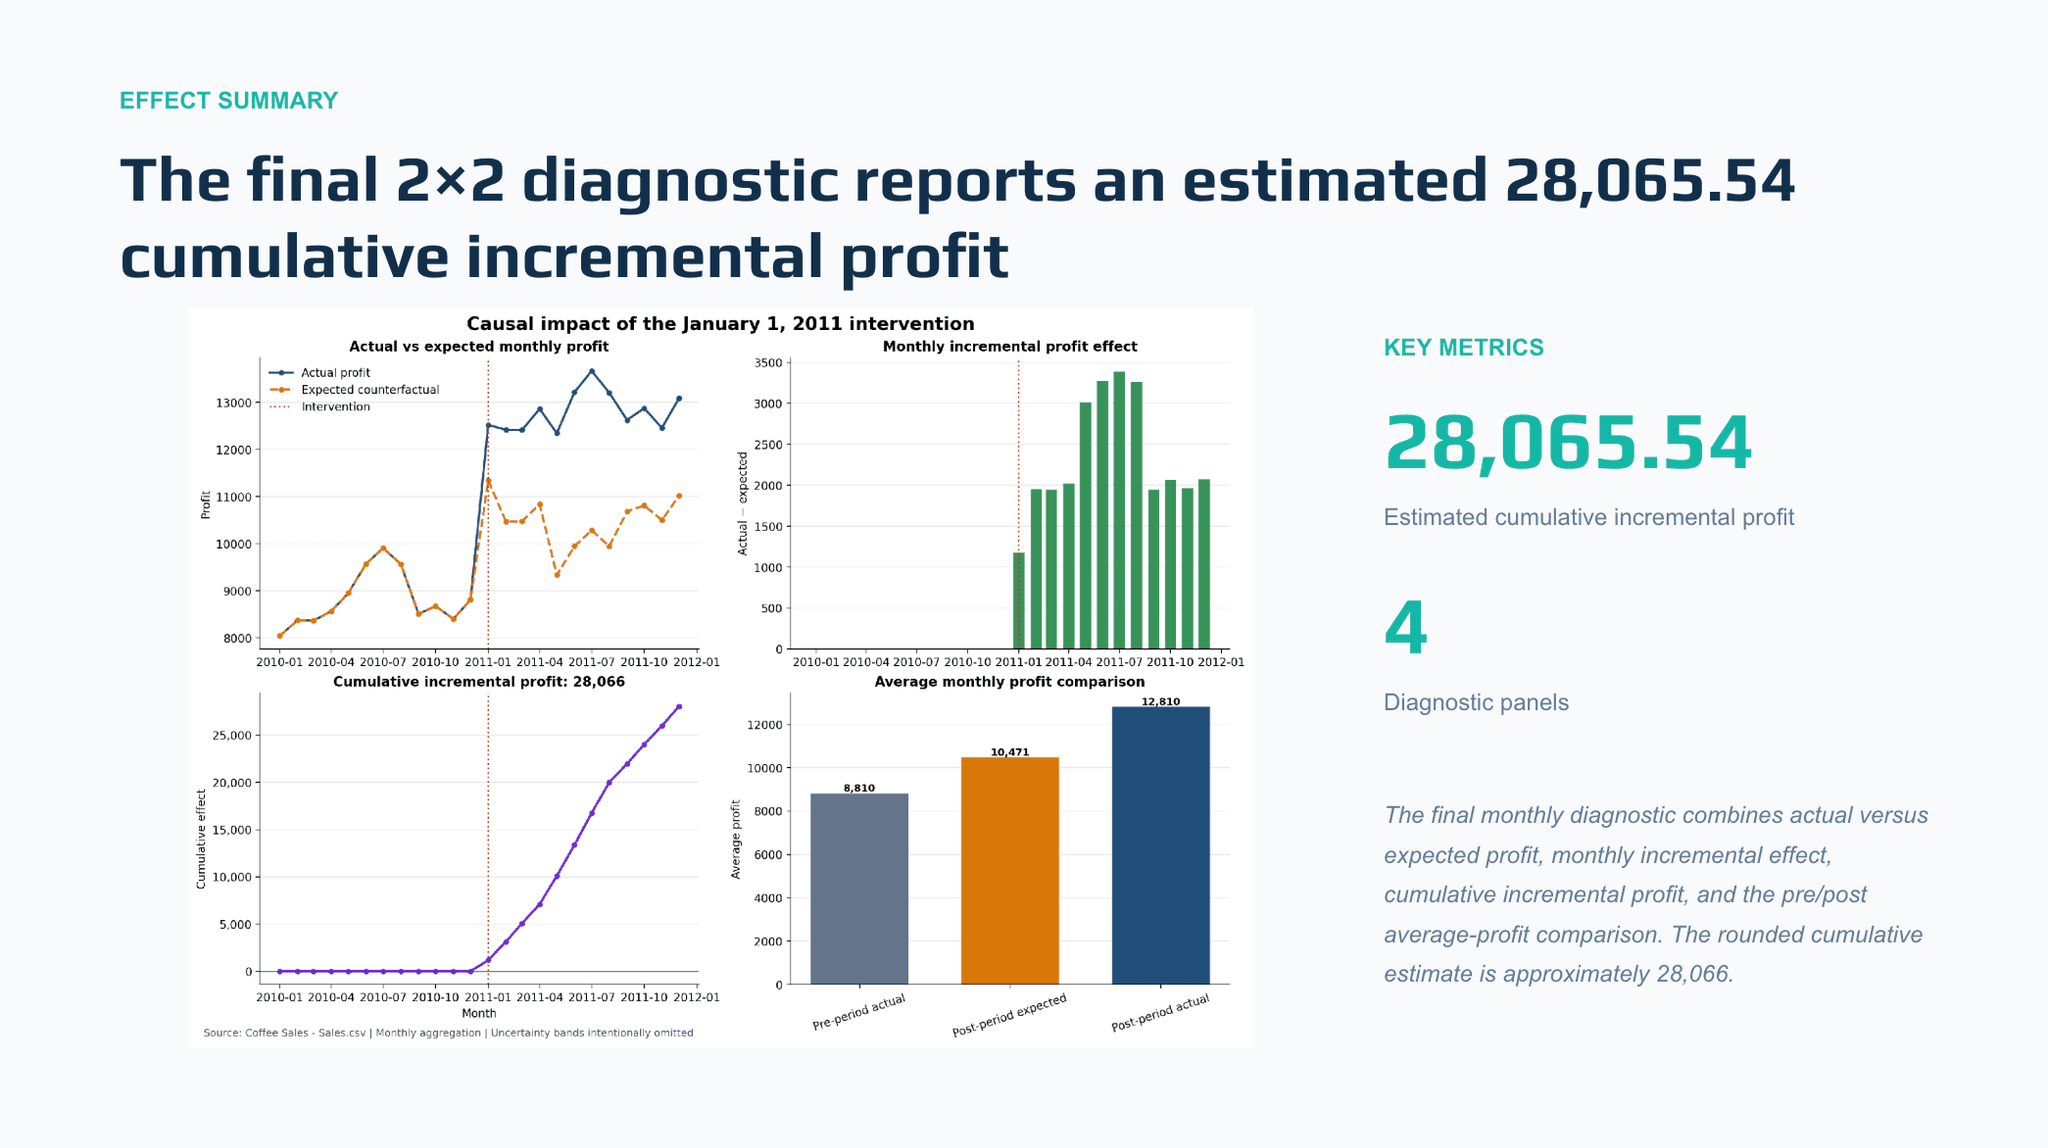
Presentations

Turn analysis into a polished presentation.

Describe what you need and AI builds the deck from your analysis—charts, speaker notes, and a fitting color palette included.

  • Slides built directly from your data and findings
  • Add optional guidance to steer the story
  • Export to PowerPoint or Google Slides, or share with a link
Explore Presentations
Generated presentation slide summarizing an analysis with charts and key metricsGenerated presentation slide summarizing an analysis with charts and key metrics

What changed

A new name and web address

The website is now betteranalyst.com, the app is at app.betteranalyst.com, and support is available at hello@betteranalyst.com.

What stays the same

Your account, work, and protections

Your account and data remain unchanged. The rebrand does not move your files, change your security controls, or require a new account.

Questions about the change

Everything you need to know

Do I need to create a new account?

No. Use the same account and sign-in method you used for Formula Bot. Because the app is moving to a new domain, your browser may ask you to sign in once.

Did my files or previous work move?

Your account, files, conversations, dashboards, and workflows remain with you. The name and domain are what changed.

Will old Formula Bot links continue to work?

Yes. Formula Bot links will redirect to the corresponding page on Better Analyst so saved links and bookmarks continue to work.

Who operates Better Analyst?

Better Analyst continues to be operated by Datasetmatch LLC.

Still have a question?

We’ll help you find your account or understand the change.

hello@betteranalyst.com