Step 1
Describe the dashboard
Build a sales dashboard with monthly revenue, pipeline by stage, rep performance, and region filters.
AI dashboard generator
Describe the dashboard you want, and Better Analyst generates the first version with charts, KPIs and filters, styled in your brand kit and ready to refresh on schedule.
See the workflow
Describe the outcome, connect your data, and let Better Analyst build the first version.
Step 1
Step 2
| Month | Revenue | Leads | Win rate |
|---|---|---|---|
| Jan | $82,400 | 142 | 24.1% |
| Feb | $91,750 | 156 | 26.8% |
| Mar | $104,300 | 173 | 28.4% |
Step 3
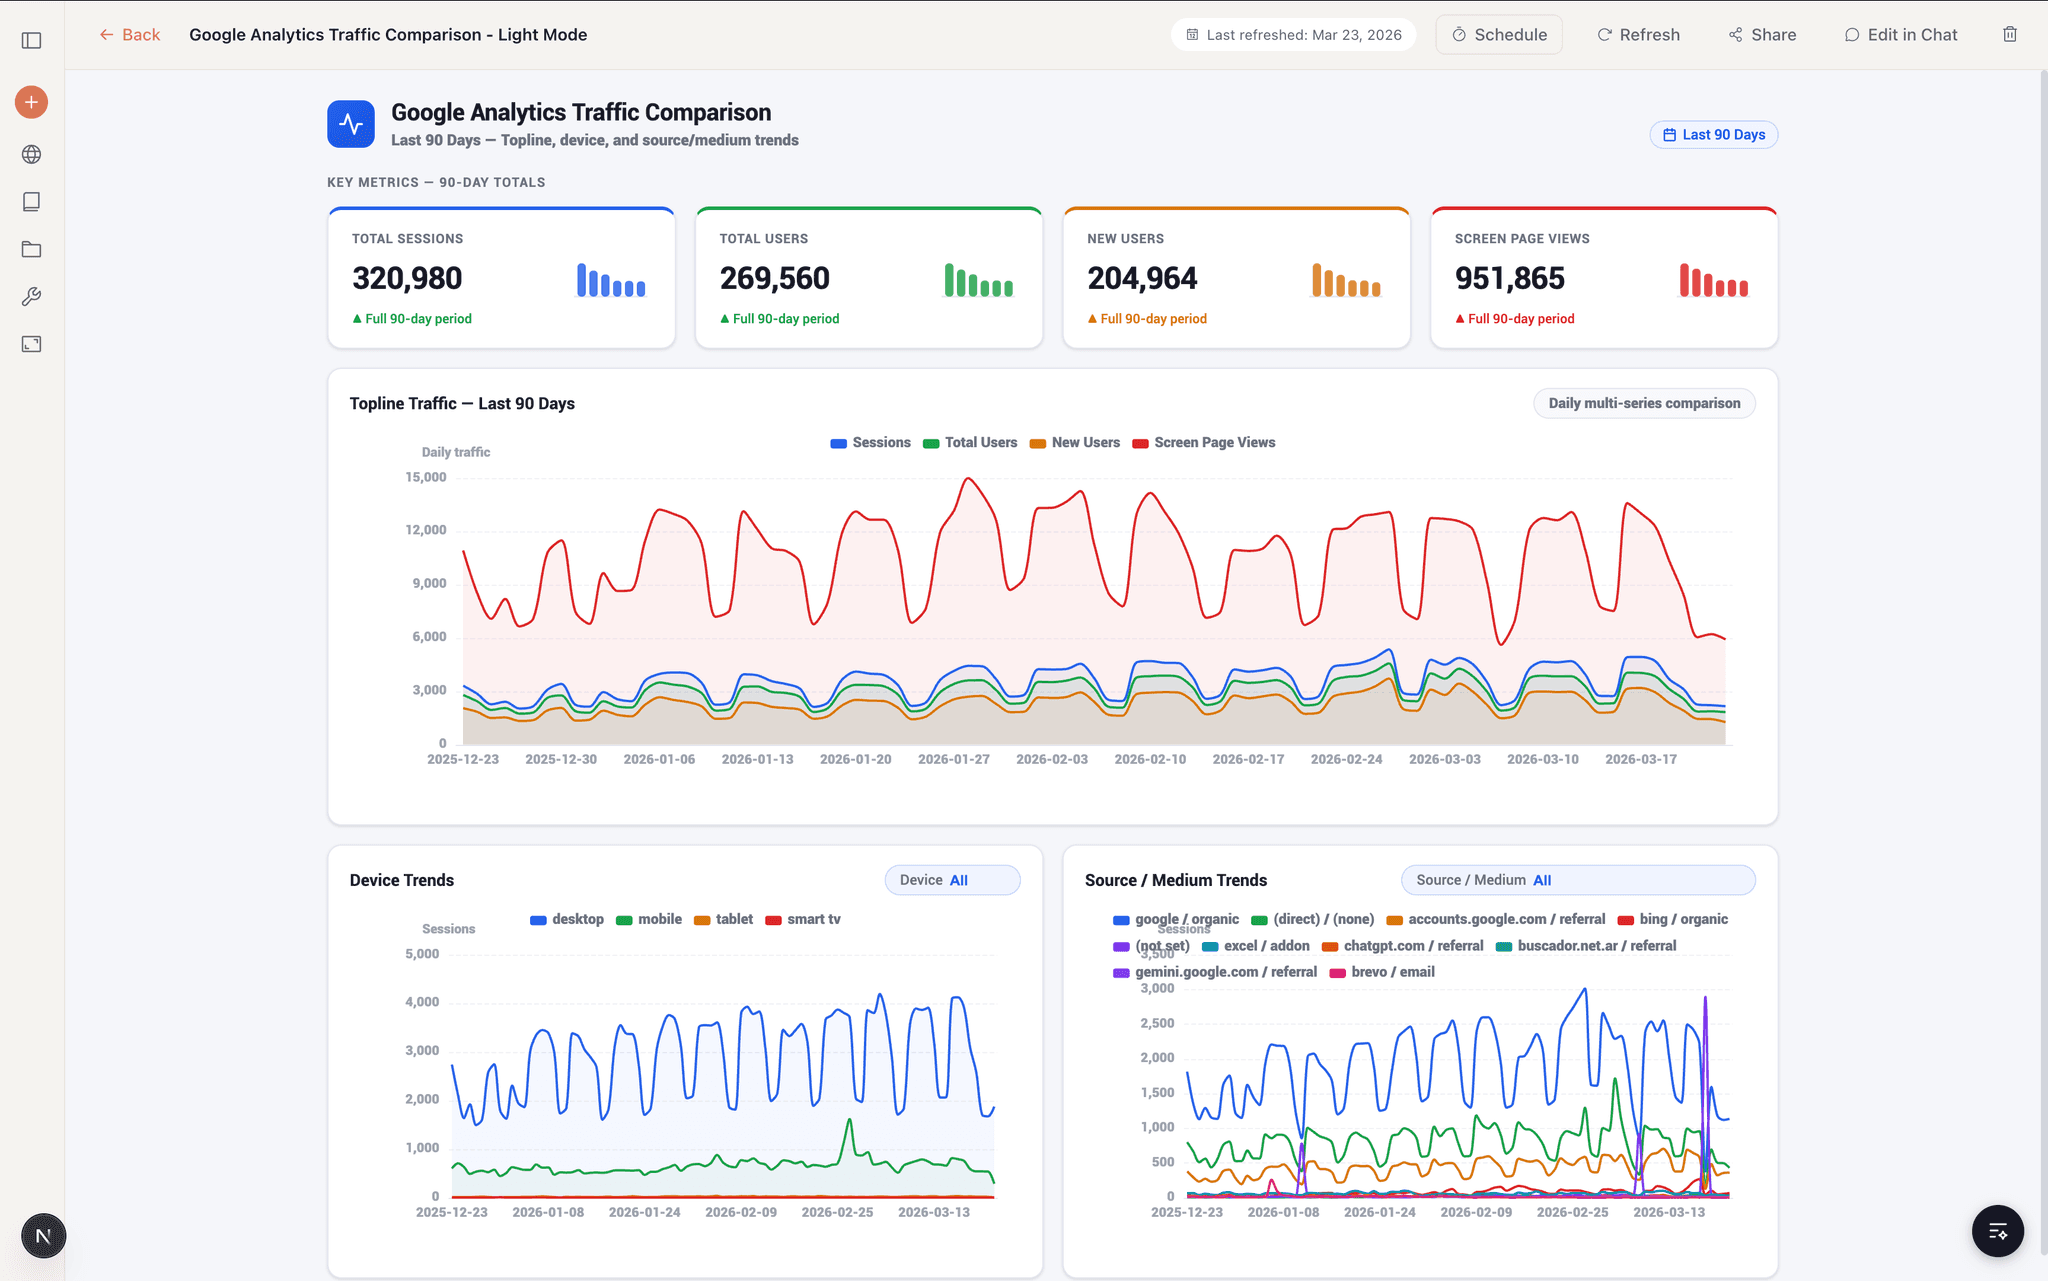
Dashboard Highlights
Start with a prompt, then use the same dashboard features that power the full product page: brand kits, editing controls, connectors, and scheduled refreshes.
Set fonts, colors, axes, and number formats for any card in the Style tab, right-click a card for its actions, or ask AI to edit, explore, or explain it. Your changes persist through every data refresh.
Bar charts, line charts, KPIs, sparklines, and more. Filter by any dimension. AI picks the best visualization for your data.
Use every supported connector, from Google Analytics, Tableau, and Power BI to databases, warehouses, and cloud files.



Run daily, weekly, or monthly. Set it and forget it. Your reports will be ready when you need them.
Automated Workflows
Dashboards re-pull your data on schedule. Your edits and customizations persist through every refresh.

Brand kits and styles
Dashboards start in your brand kit’s colors, fonts and logo. Or pick a look, then restyle any chart by asking or in its Style tab.
Use a plain-English prompt to generate the first draft, then refine the charts and layout from there.
Track revenue, margin, growth, and top-line trends in a layout that is ready for weekly leadership reviews.
Break down pipeline, win rates, rep performance, and regional trends with filters that make drill-down easy.
Pull campaign performance, channel attribution, and funnel conversion into one view your team can actually use.
Watch throughput, response times, backlog, and service levels with charts that stay current automatically.
Turn raw exports into clean dashboards for budgets, actuals, variances, and forecast tracking.
Generate polished dashboards you can share publicly or embed after you refine the final layout.
Compare your options
Open a neutral research prompt in the AI tool you already use. Compare capabilities, limitations, and fit before you choose.
AI answers can be incomplete. Check source links, current pricing, and product documentation before deciding.
Describe the dashboard you want and Better Analyst handles the heavy lifting from the first layout to refresh-ready reporting.