Free AI Gantt Chart Maker From Your Project Plan

List your tasks with a start date and an end date and ask for a Gantt chart. Better Analyst draws one bar per task on a calendar axis, shows where tasks overlap and marks milestones. You can download the image and the task table.

Updated

  • Free plan included
  • No credit card required
  • AI data chat

Free account required. Press Cmd+Enter to submit. Prompts stay in this browser during sign-up.

See the workflow

From your data to a finished chart

A genuine Better Analyst output generated on October 6, 2026 from the synthetic task dates below. The downloaded chart and source workbook are unedited. Task bars include both start and end dates; no dependencies or critical path were inferred.

Step 1

Describe your data and chart

Create a synthetic website-launch Gantt: research August 4–7, design August 7–13, development August 12–22, QA August 21–26, and launch milestone August 28, 2026. Preserve the dates and overlaps. Provide a PNG and an Excel task table. Do not infer dependencies or critical-path scheduling.
Step 2

AI organizes the project plan

  • Supplied start and end dates
  • Overlapping task bars
  • Launch milestone

Step 3

Website launch timeline

Website launch timeline
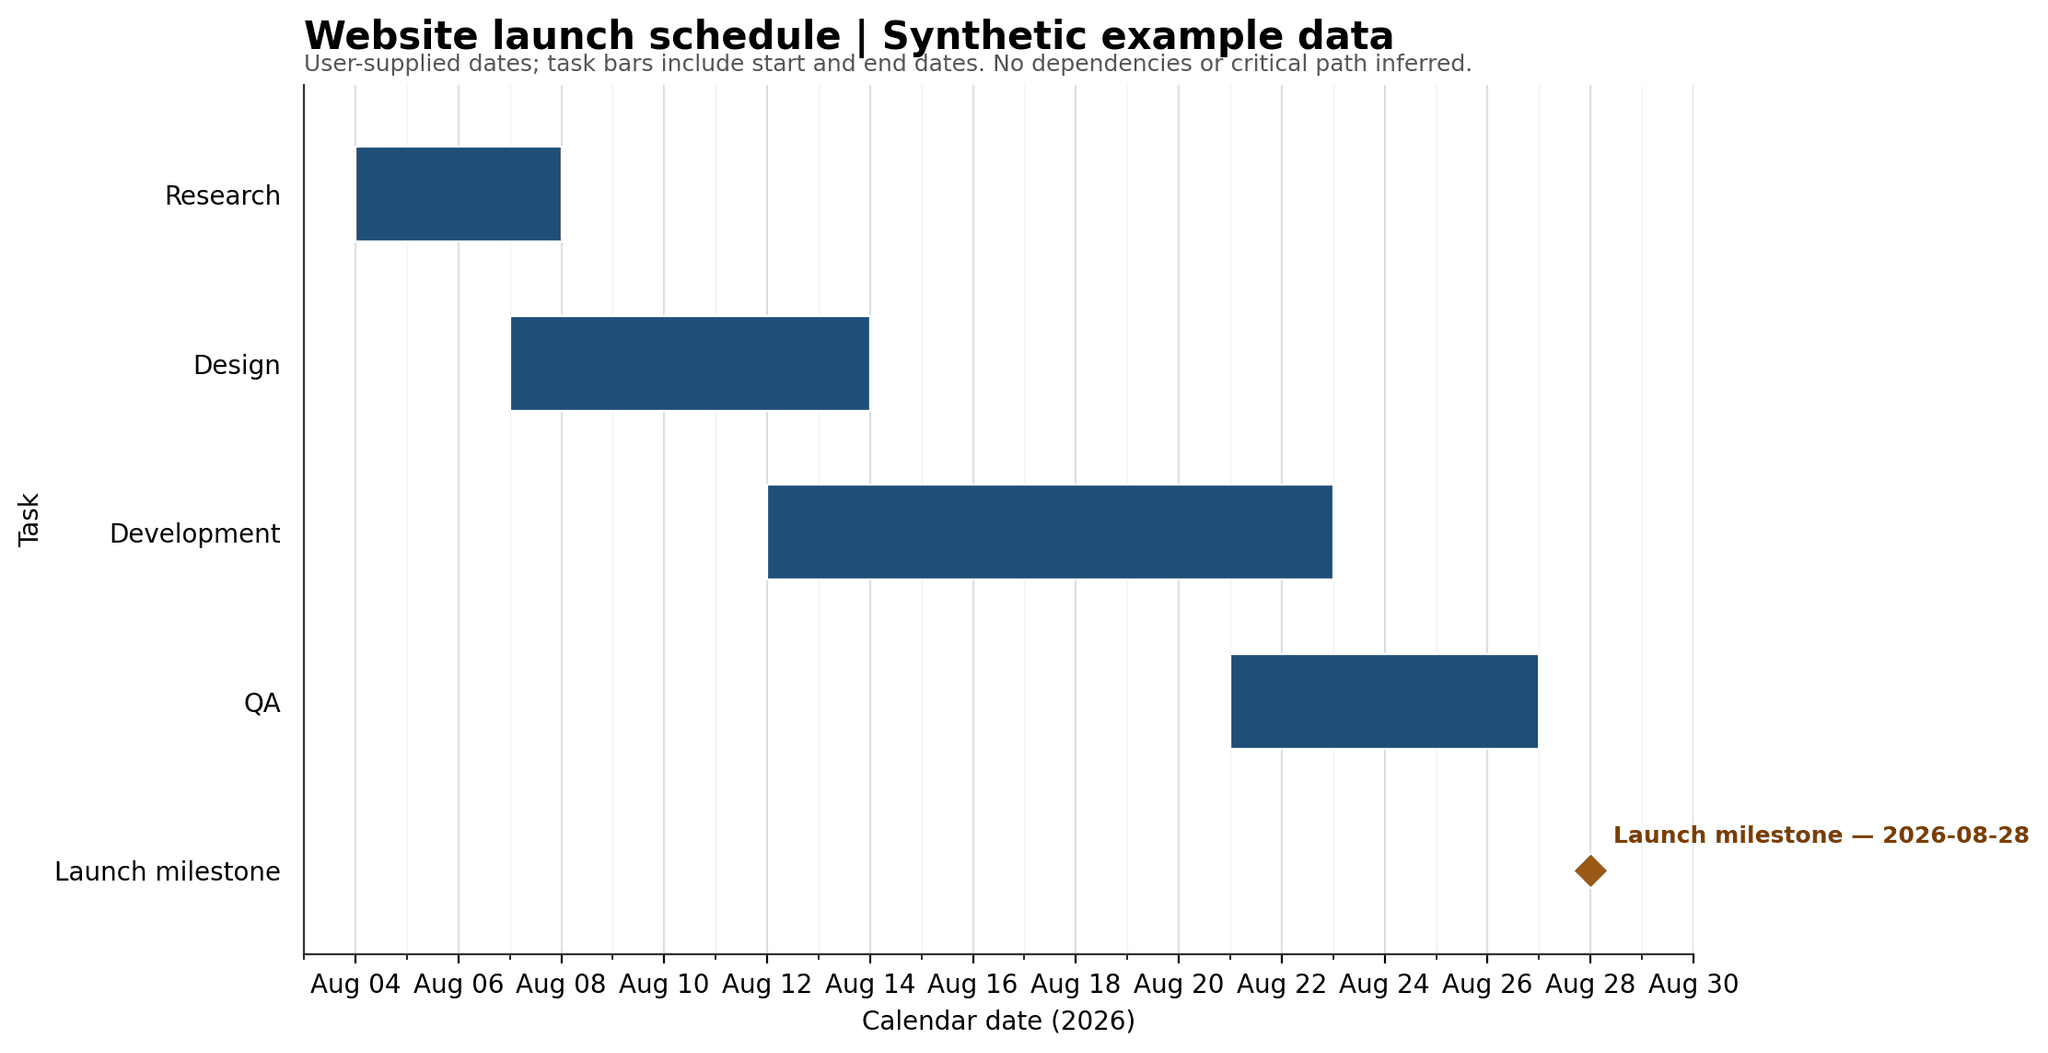
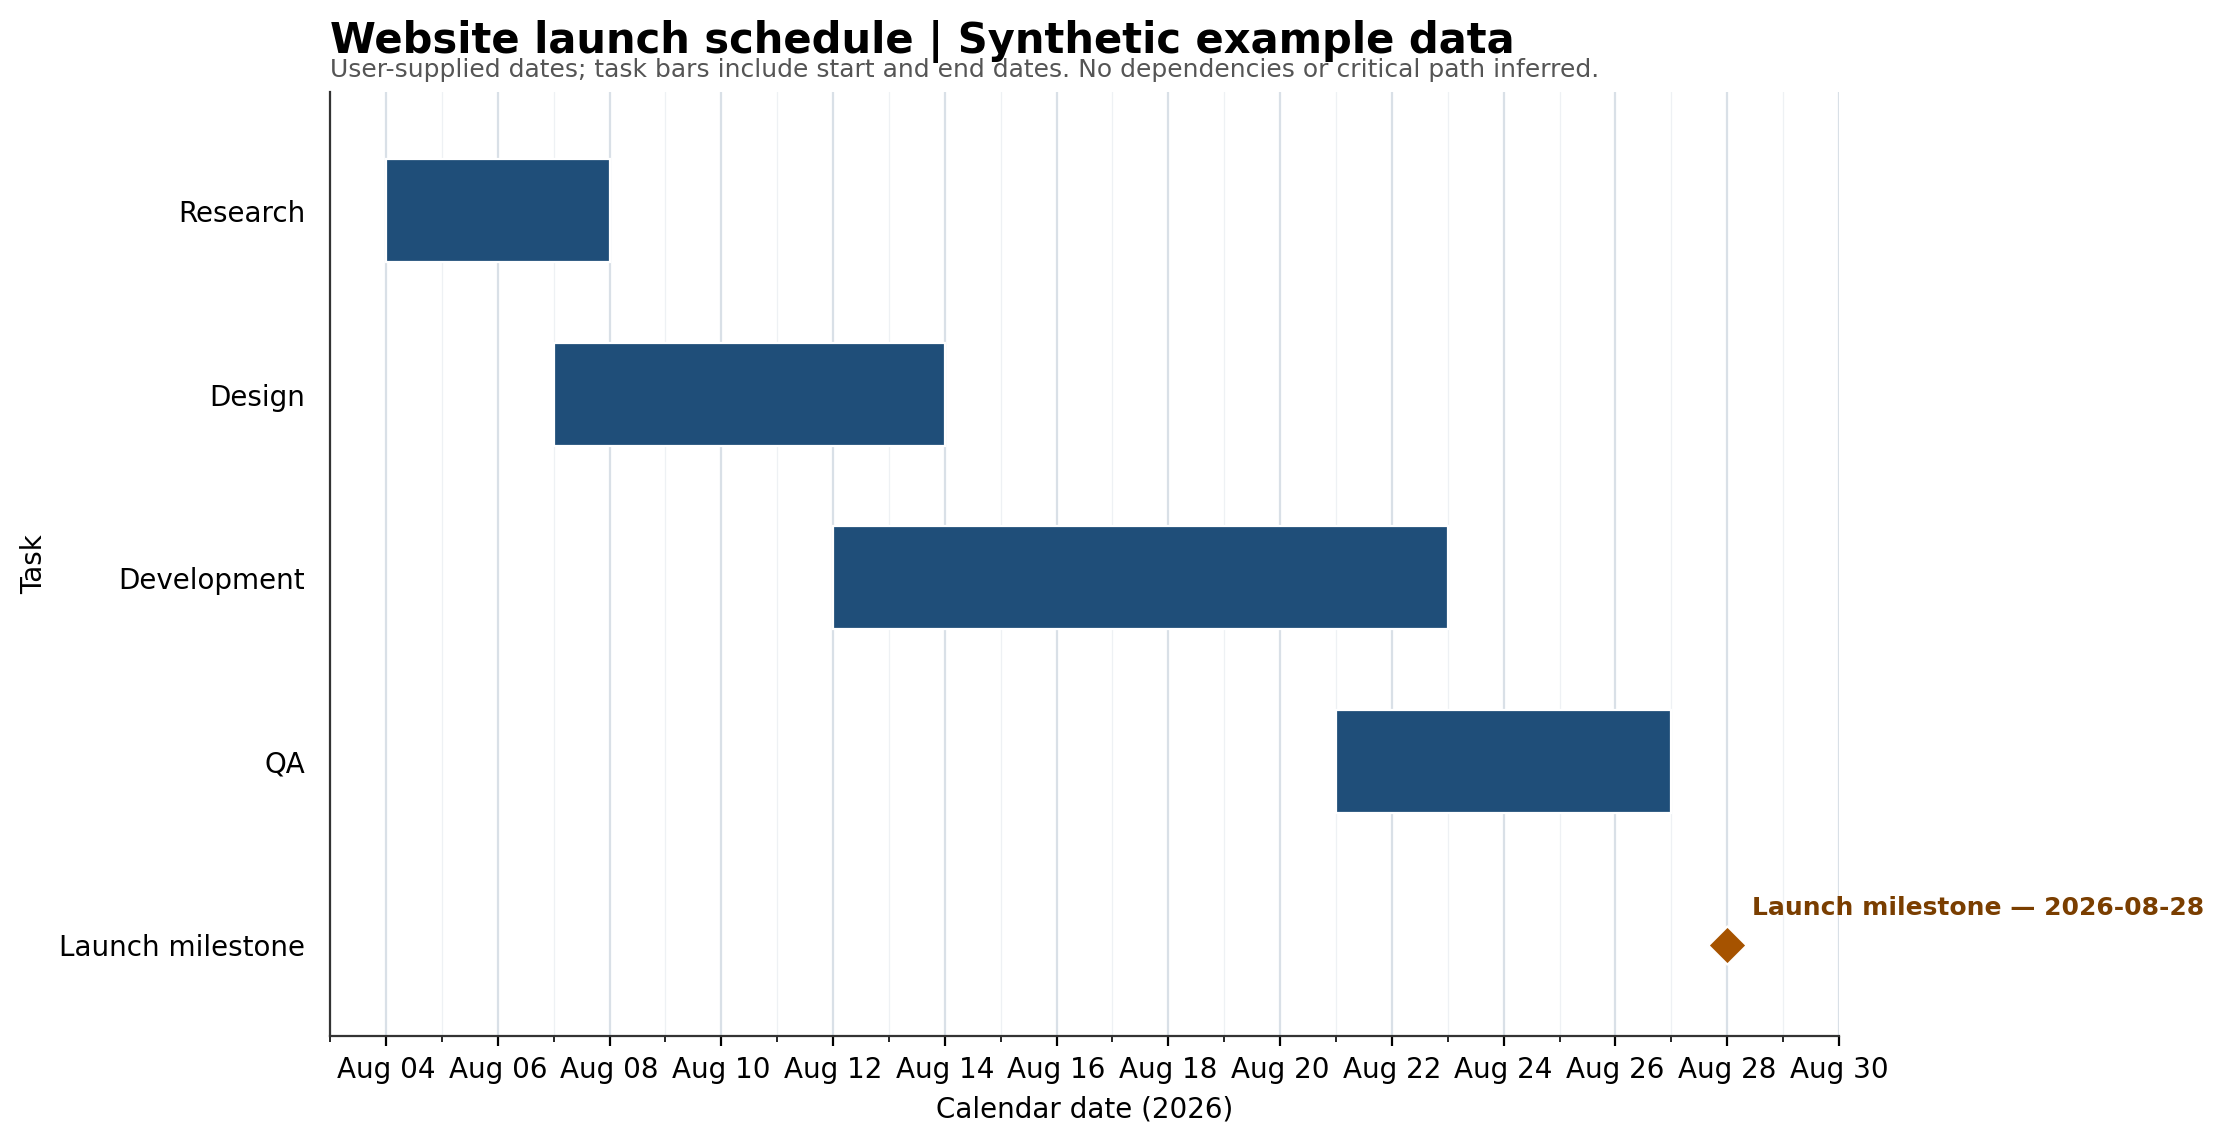
Actual synthetic website-launch Gantt: Research August 4–7, Design August 7–13, Development August 12–22, QA August 21–26, launch milestone August 28, 2026.
A Gantt timeline from August 4 through August 28 showing research, design, development, and QA tasks with overlaps and a final launch milestone.
Synthetic task inputs (2026)
TaskStartEnd
Research2026-08-042026-08-07
Design2026-08-072026-08-13
Development2026-08-122026-08-22
QA2026-08-212026-08-26
Launch milestone2026-08-282026-08-28

The workbook contains the task table, not an interactive scheduling engine. This example demonstrates dates, overlaps and a milestone—not automatic rescheduling or critical-path calculation. Creating your own chart requires an account and is subject to plan limits.

How to make a Gantt chart

  1. List the tasks. Give each task a name, a start date and an end date, with the year, for example 2026-08-04.
  2. Mark milestones. Note one-day events, such as a launch, separately from tasks that span several days.
  3. Ask for the chart. Paste the list into the box above or upload the sheet, and ask for a Gantt chart.
  4. Check dates and overlaps. The chart shows the dates you supplied. It does not work out dependencies or reschedule tasks for you.
  5. Adjust and download. Change task names, date columns or the column that colors the bars under Customize, then download the chart.

Worked example: website launch plan

These are the tasks from the example prompt above, as the table you would paste or upload.

Synthetic example data. End dates are inclusive.
TaskStartEndOverlaps with
Research2026-08-042026-08-07Design on Aug 7
Design2026-08-072026-08-13Development on Aug 12 to 13
Development2026-08-122026-08-22QA on Aug 21 to 22
QA2026-08-212026-08-26None after Aug 22
Launch (milestone)2026-08-282026-08-28None

When to use a Gantt chart

Best for

  • Scheduling tasks with start dates, end dates, and milestones
  • Showing dependencies and overlapping work
  • Communicating a project plan across teams

Avoid when

Avoid a Gantt chart when the main question is how a decision or process works rather than when work happens. Use a flow chart for process logic or a calendar heatmap for daily activity patterns.

Compare related chart types

What is a Gantt chart?

A Gantt chart places tasks on a calendar. Each horizontal bar shows when a task starts and ends, so you can see overlaps and the overall schedule. A milestone marks an event rather than a span of work.

What data should you provide?

Supply a task name, start date and end date for each task. Include the year and use an unambiguous date format such as 2026-08-04. State which events are milestones and whether end dates are inclusive. The example above includes both the start and end dates in each task bar.

How to make this example in Better Analyst

Create an account, paste the task dates and ask for a Gantt chart with a downloadable image and a source task workbook. Check the generated dates, overlaps and labels against your inputs before sharing the result. Account and usage limits apply.

Read the website launch example

Research and design overlap on August 7. Design and development overlap on August 12 and 13. Development and QA overlap on August 21 and 22. The launch milestone is August 28. These overlaps reflect supplied dates, not inferred task dependencies.

What this example does not demonstrate

The PNG is a static chart. The Excel download contains the source task table; it is not a scheduling engine. This example does not demonstrate automatic dependency management, critical-path calculation, progress tracking or automatic rescheduling. If a task date changes, update your inputs and ask for a revised chart, then verify it again.

Gantt chart or another chart?

Use a Gantt chart to compare task timing. A flow chart is better for decisions and process steps. A calendar heatmap is useful for daily activity intensity, and a line chart is useful for a metric changing over time.

Better Analyst AI charts

Turn your data into charts with Better Analyst

Upload your data, generate the right chart, ask follow-up questions, and refine the visualization in plain English.

No credit card required. Free plan included.

Try Better Analyst free

Frequently Asked Questions

Yes. You can make Gantt charts on the Better Analyst free plan. You create a free account first, with no credit card. Paid plans add more usage; see the pricing page for current plans.
Yes, if the plan has a task name, start date and end date for each task. Paste the plan or upload the spreadsheet and ask for a Gantt chart. Check the dates against your plan before you share it.
No. The chart shows the start and end dates you supply and where tasks overlap. It is not a scheduling engine, so it does not manage dependencies, calculate a critical path or reschedule tasks.
Excel has no built-in Gantt chart type. The usual method is a stacked bar chart: one series for the start date, which you hide, and one for the duration, with the task axis in reverse order.

Compare your options

Decide with evidence, not a sales pitch.

Open a neutral research prompt in the AI tool you already use. Compare capabilities, limitations, and fit before you choose.

  1. 01ChatGPTOpen a balanced comparison prompt in ChatGPT.
  2. 02ClaudeOpen the same research prompt in Claude.
  3. 03PerplexityResearch the comparison with linked web sources.

AI answers can be incomplete. Check source links, current pricing, and product documentation before deciding.