AI dashboards
Dashboards that look like your company made them.
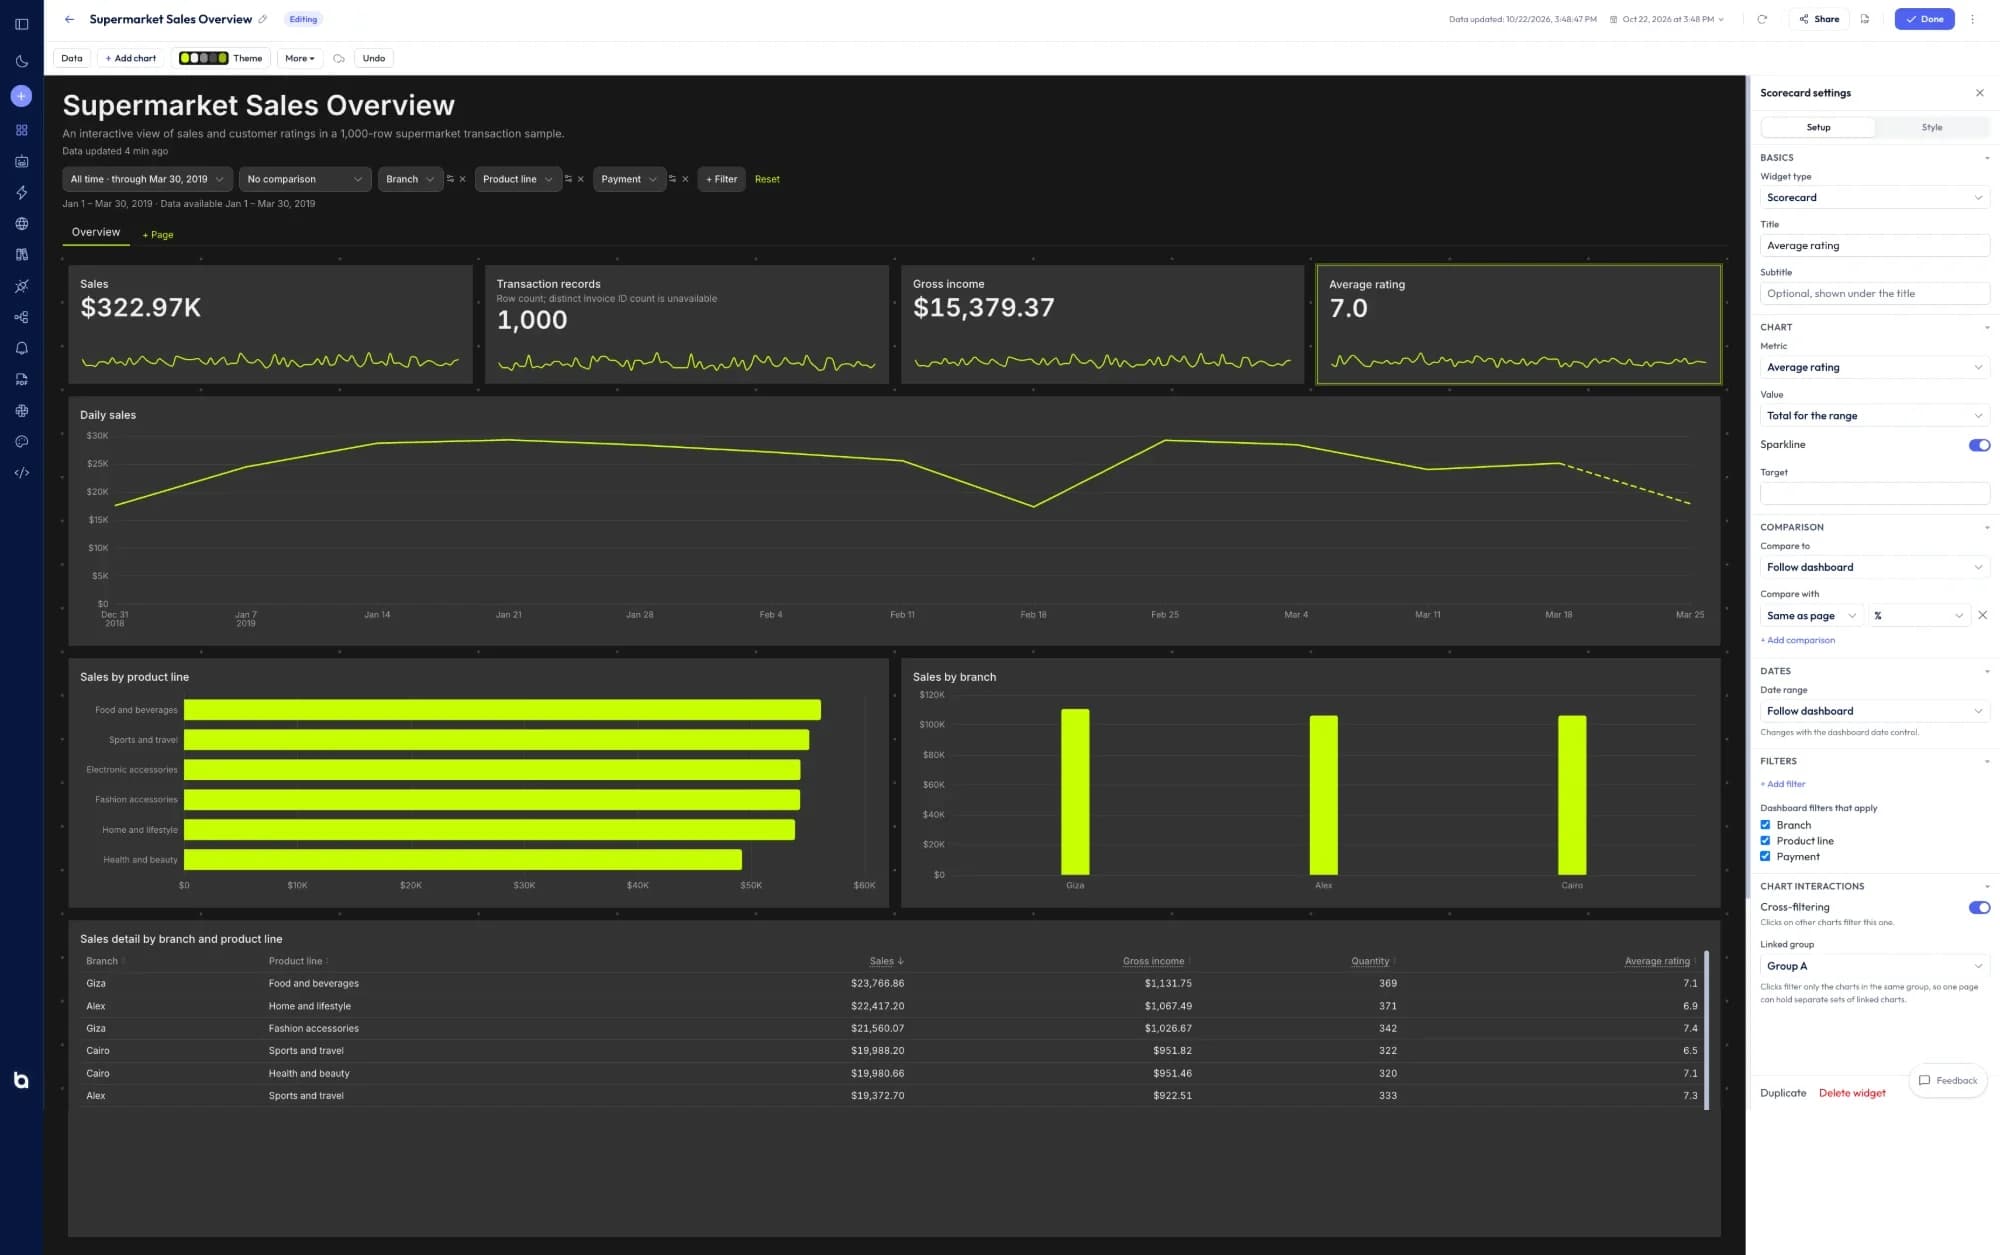
Describe the dashboard you need. Better Analyst builds it in your brand kit’s colors, fonts and logo, then lets you restyle any chart by asking or by hand. It refreshes on schedule and stays on brand wherever you share it.
Brand kits
Set your brand once. Every dashboard starts on it.
A brand kit holds your colors, fonts, logo and number formats. Make it your workspace default or give each client Project its own kit, and the same look carries into charts, spreadsheets and reports.
- Colors
- A palette that dashboards check for contrast and color-blind readability
- Fonts
- Display, body and number fonts
- Logo
- Placed where you choose, at the size you choose
- Number formats
- Currency, decimal places, separators and how negatives show
- Footer and disclaimer
- Standard text for the outputs you share
Northwind Outdoor
Workspace defaultLogo · top left · medium
Display font
Playfair
Numbers
$1.2M · (4.1%)
Styles
Pick a look, then change anything.
Start from one of six looks or from your brand kit. Then adjust the whole page in the Theme panel and each chart in its Style tab, or just ask for the change.
- Card styles: standard, accent bar, tinted, outline or none
- Nine fonts, title case and sizes for titles and KPIs
- Corners, borders, shadows and spacing
- Axes, number formats, reference and trend lines on every chart
- Table conditional formatting and data bars
- Colors that apply live while you pick them
Built by chatting, finished by hand.
Describe it and it’s built
Ask for the dashboard you need from a spreadsheet or a live connection. Better Analyst picks the metrics, charts and layout, and applies your brand kit.
Change it by asking, or by hand
Ask the AI on any card to change a chart, dig into a number or explain it. Or drag cards around the canvas and use the Setup and Style tabs.
Filters people actually use
Date ranges with comparisons, Looker-style filter controls, and chart clicks that filter the whole page.
It stays current
Schedule refreshes, export to PDF, set alerts on any metric, and swap in another data source to reuse the dashboard for the next client.
Compare your options
Decide with evidence, not a sales pitch.
Open a neutral research prompt in the AI tool you already use. Compare capabilities, limitations, and fit before you choose.
- 01ChatGPTOpen a balanced comparison prompt in ChatGPT.
- 02ClaudeOpen the same research prompt in Claude.
- 03PerplexityResearch the comparison with linked web sources.
AI answers can be incomplete. Check source links, current pricing, and product documentation before deciding.
Your data, in your brand,
refreshed on schedule.
Free plan, no credit card. Bring a spreadsheet or connect a source.