Data Storytelling: What It Is, How to Do It, and a Worked Example
The three parts of a data story, six steps to build one, and a story built from 1,000 supermarket orders, with every number traced back to the data.

Summary
Data storytelling is explaining what data means to a specific audience by combining three things: the data, visuals, and a narrative that connects them. A good data story answers one question with a few charts in a deliberate order, makes one claim per chart, checks every number against the data, and ends with what to do next and what the data can't tell you.
On this page
The short answer
Data storytelling is explaining what data means to a specific audience by combining the data, visuals and a narrative. To build one, pick one question and one reader, find the finding, choose three to six charts in order, write one claim per chart, check every number against the data, and end with what to do next.
What is data storytelling?
Data storytelling is the step between finding something in your data and getting someone to act on it. You take a result, decide what it means for a particular reader, and walk them through it in an order that makes sense, with a chart for each point and words that say what the chart shows.
It has three parts:
- Data: the evidence. Every claim in the story should trace back to a number you can check.
- Visuals: charts that make the pattern obvious at a glance. One chart, one point.
- Narrative: the sentences that connect the charts: what happened, why it matters to this reader, and what to do about it.
Brent Dykes organises his book Effective Data Storytelling: How to Drive Change with Data, Narrative and Visuals around these same three parts. Leave one out and the story breaks. Charts with no narrative make the reader guess the point. A narrative with no data is an opinion. Data with no visuals is a table nobody reads.
Data storytelling vs data visualization vs dashboards
| Data visualization | Dashboard | Data story | |
|---|---|---|---|
| What it is | A chart of some data | Many charts on one page | A few charts in order, with text |
| Who decides where to look | The reader | The reader | The author |
| Best for | Seeing one pattern | Monitoring metrics you check often | Explaining one finding to people who read it once |
| Typical length | One chart | A page of charts | 3–6 charts, a paragraph each |
| Ends with | Nothing | Nothing | What to do next |
Most business reporting needs both: a dashboard for the people who run the numbers every week, and a story for the people who need the conclusion.
How to tell a story with data in 6 steps
- Pick one question and one reader. "Which product lines lead and which lag?" for store managers is a story. "Everything about Q3" for everyone is a dashboard. The reader decides how much detail and jargon you can use.
- Find the finding before you write. Analyse first. A story is the explanation of something you already know, not the search for it.
- Choose three to six charts and put them in order. Lead with the headline result, then the evidence that qualifies or explains it. Drop any chart that doesn't support a point you'll make.
- Write one claim per chart. Give each chart a heading that states the point ("Food and beverages narrowly leads sales"), not the topic ("Sales by product line"). Then one short paragraph with the numbers that prove it.
- Check every number. Each figure in the text should come from the chart beside it. Recalculate percentages and rankings, and watch for a number copied from an older version of the data.
- End with what to do next and what the data can't tell you. Two or three concrete follow-ups, plus the limits: the period covered, what's missing, and whether the differences are big enough to matter.
Worked example: a story from 1,000 supermarket orders
To show the steps on real data, this example uses the supermarket sales sample file that comes with Better Analyst: 1,000 orders across three branches and six product lines, from January to March 2019. The file was attached in Data story mode with this request:
Try this prompt
“Turn my analysis into a data story. Focus on: which product lines lead and which lag”
Run it in Better AnalystThe result was a three-chapter story titled "Which Product Lines Lead—and Lag?", with each chapter's text beside a pinned chart that changes as you scroll.
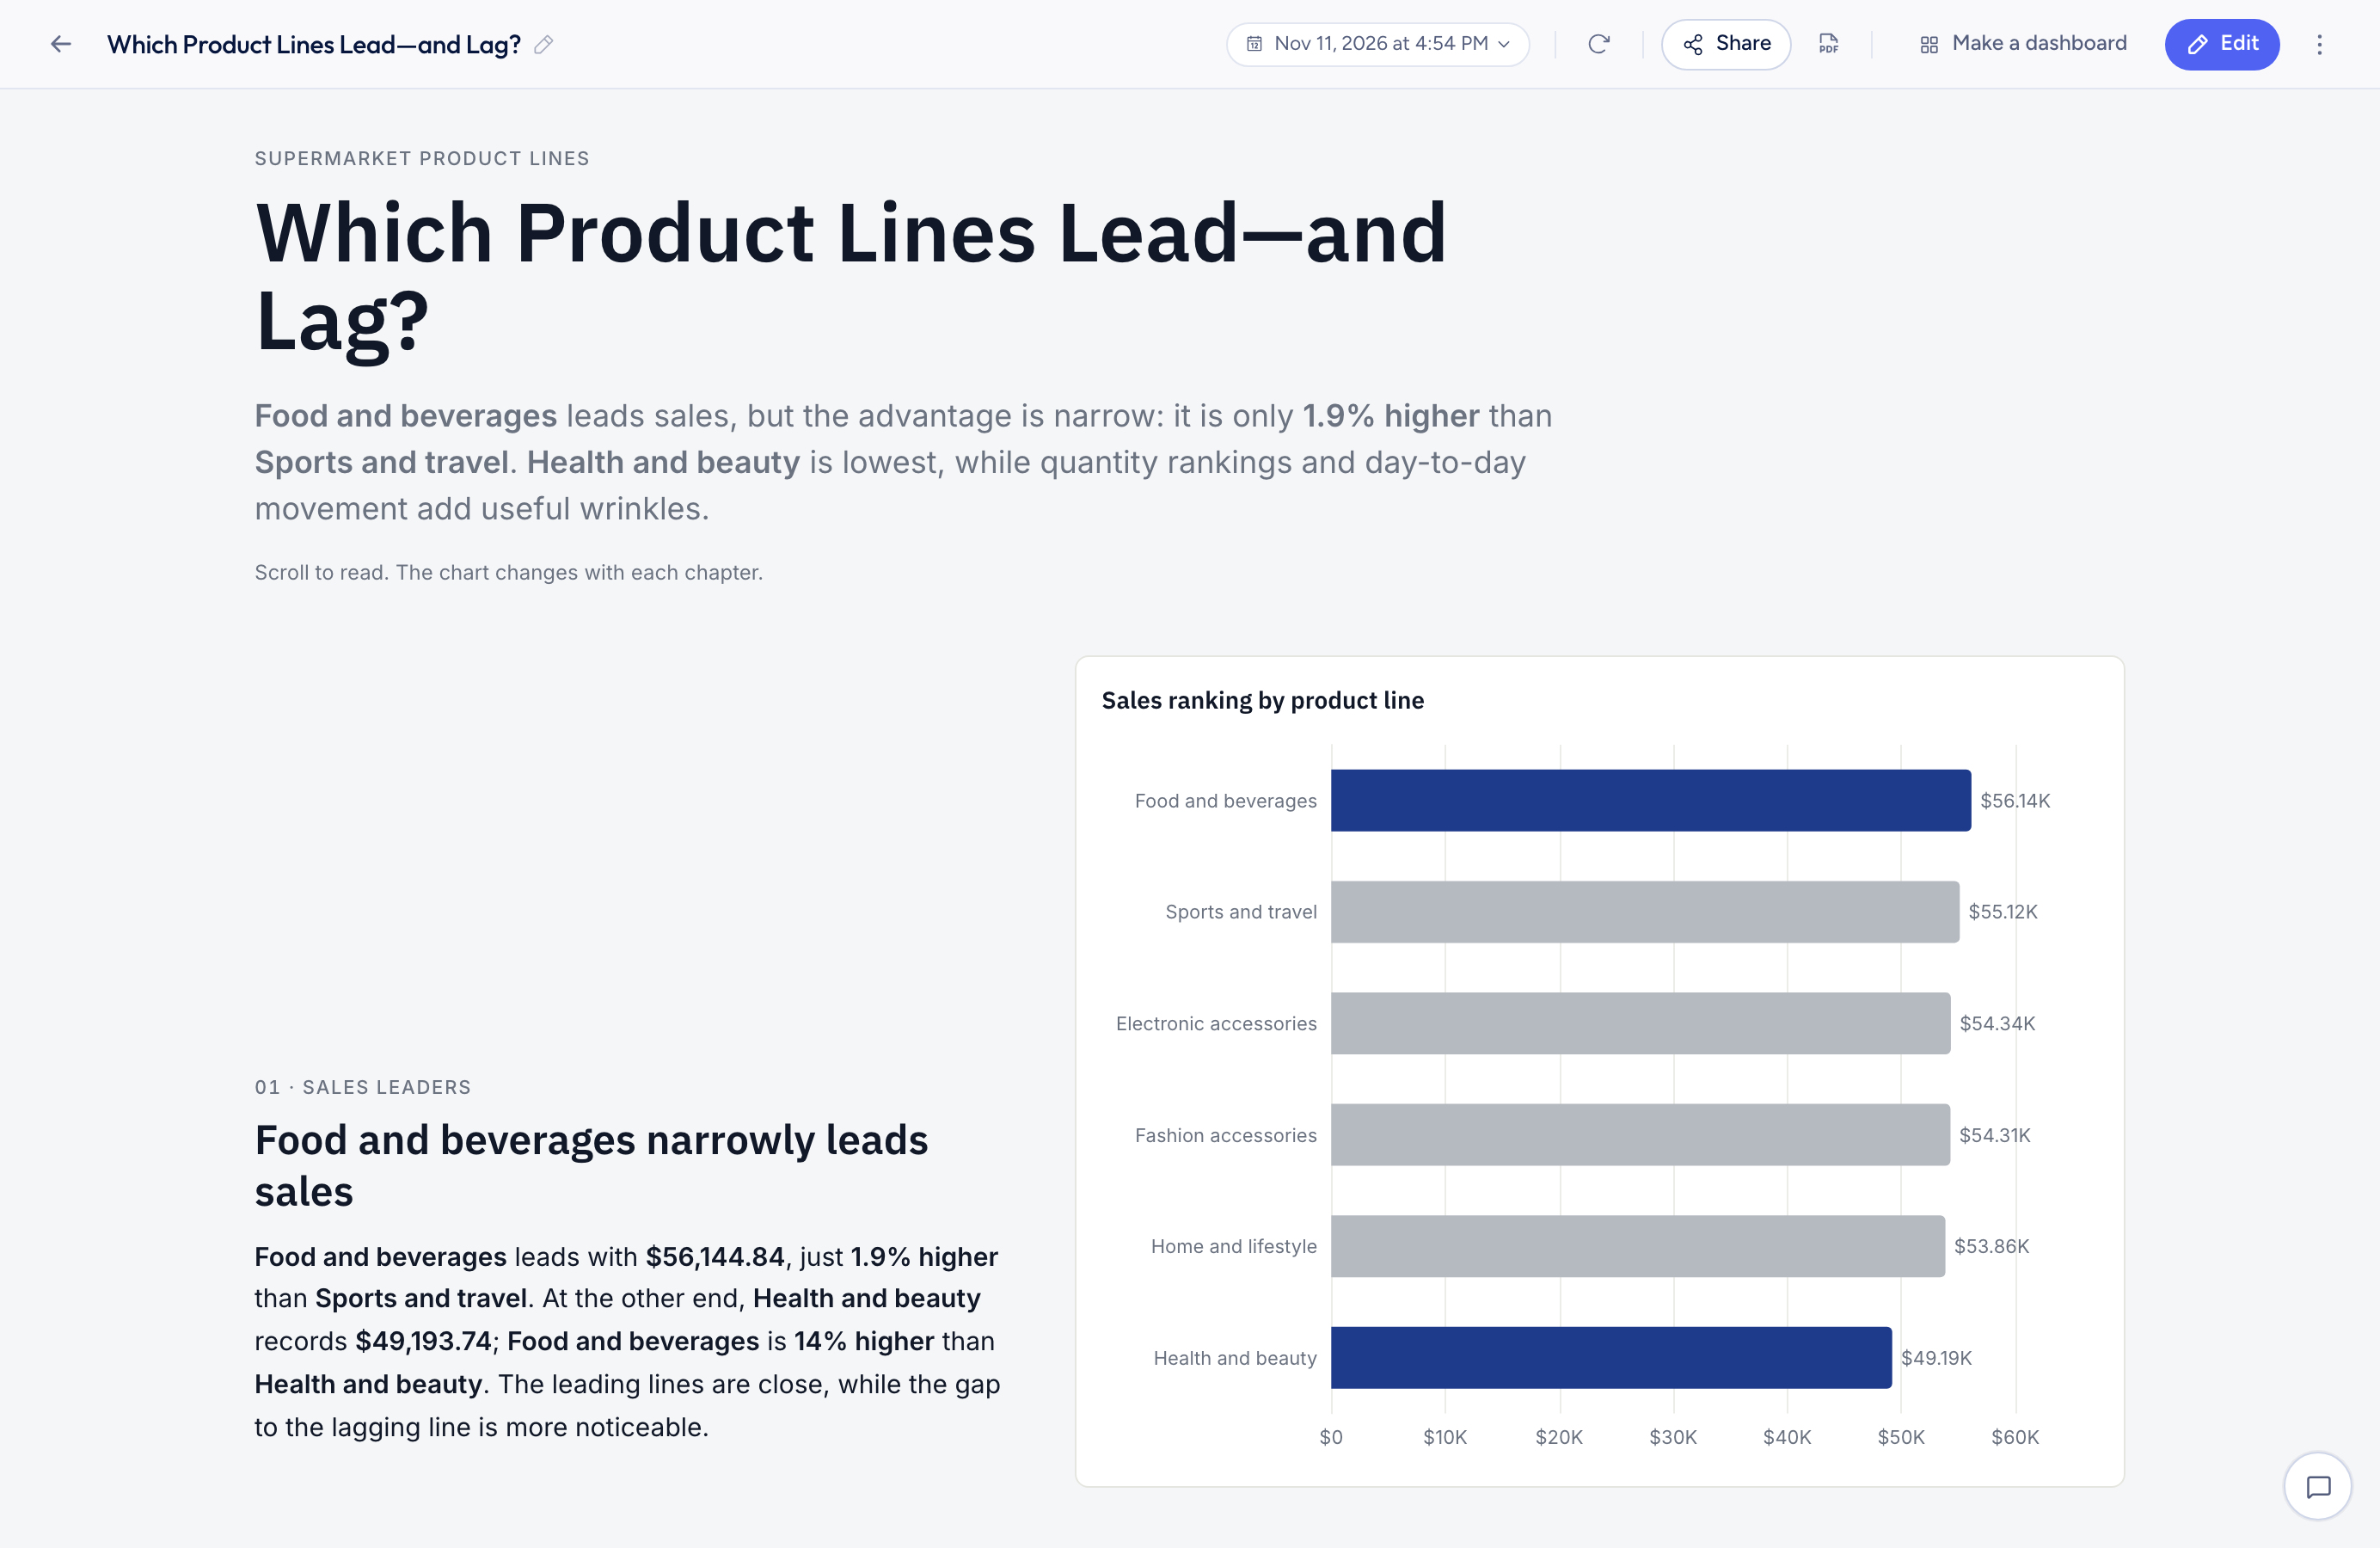
Here is how it lines up with the six steps:
| Chapter | Chart | Claim |
|---|---|---|
| 1. Sales leaders | Sales by product line (bar) | Food and beverages leads with $56,144.84, just 1.9% higher than sports and travel. Health and beauty is lowest at $49,193.74. |
| 2. Quantity sold | Quantity share (donut) | Electronic accessories sells the most units (971), food and beverages is close behind (952), and health and beauty sells the fewest (854). |
| 3. Daily movement | Daily sales by product line (line) | Some lines swing sharply from the first day to the last, but that doesn't change who leads overall. |
The opening paragraph states the headline in one sentence, and the story ends with a "What to look at next" list: check whether the close ranking holds in other periods, look at stock and promotions for the unit leaders and laggers, and investigate the daily swings before calling them trends. It also states its limits: the figures describe this sample and period, say nothing about why the lines differ, and don't include profit by product line.
How the numbers stay right
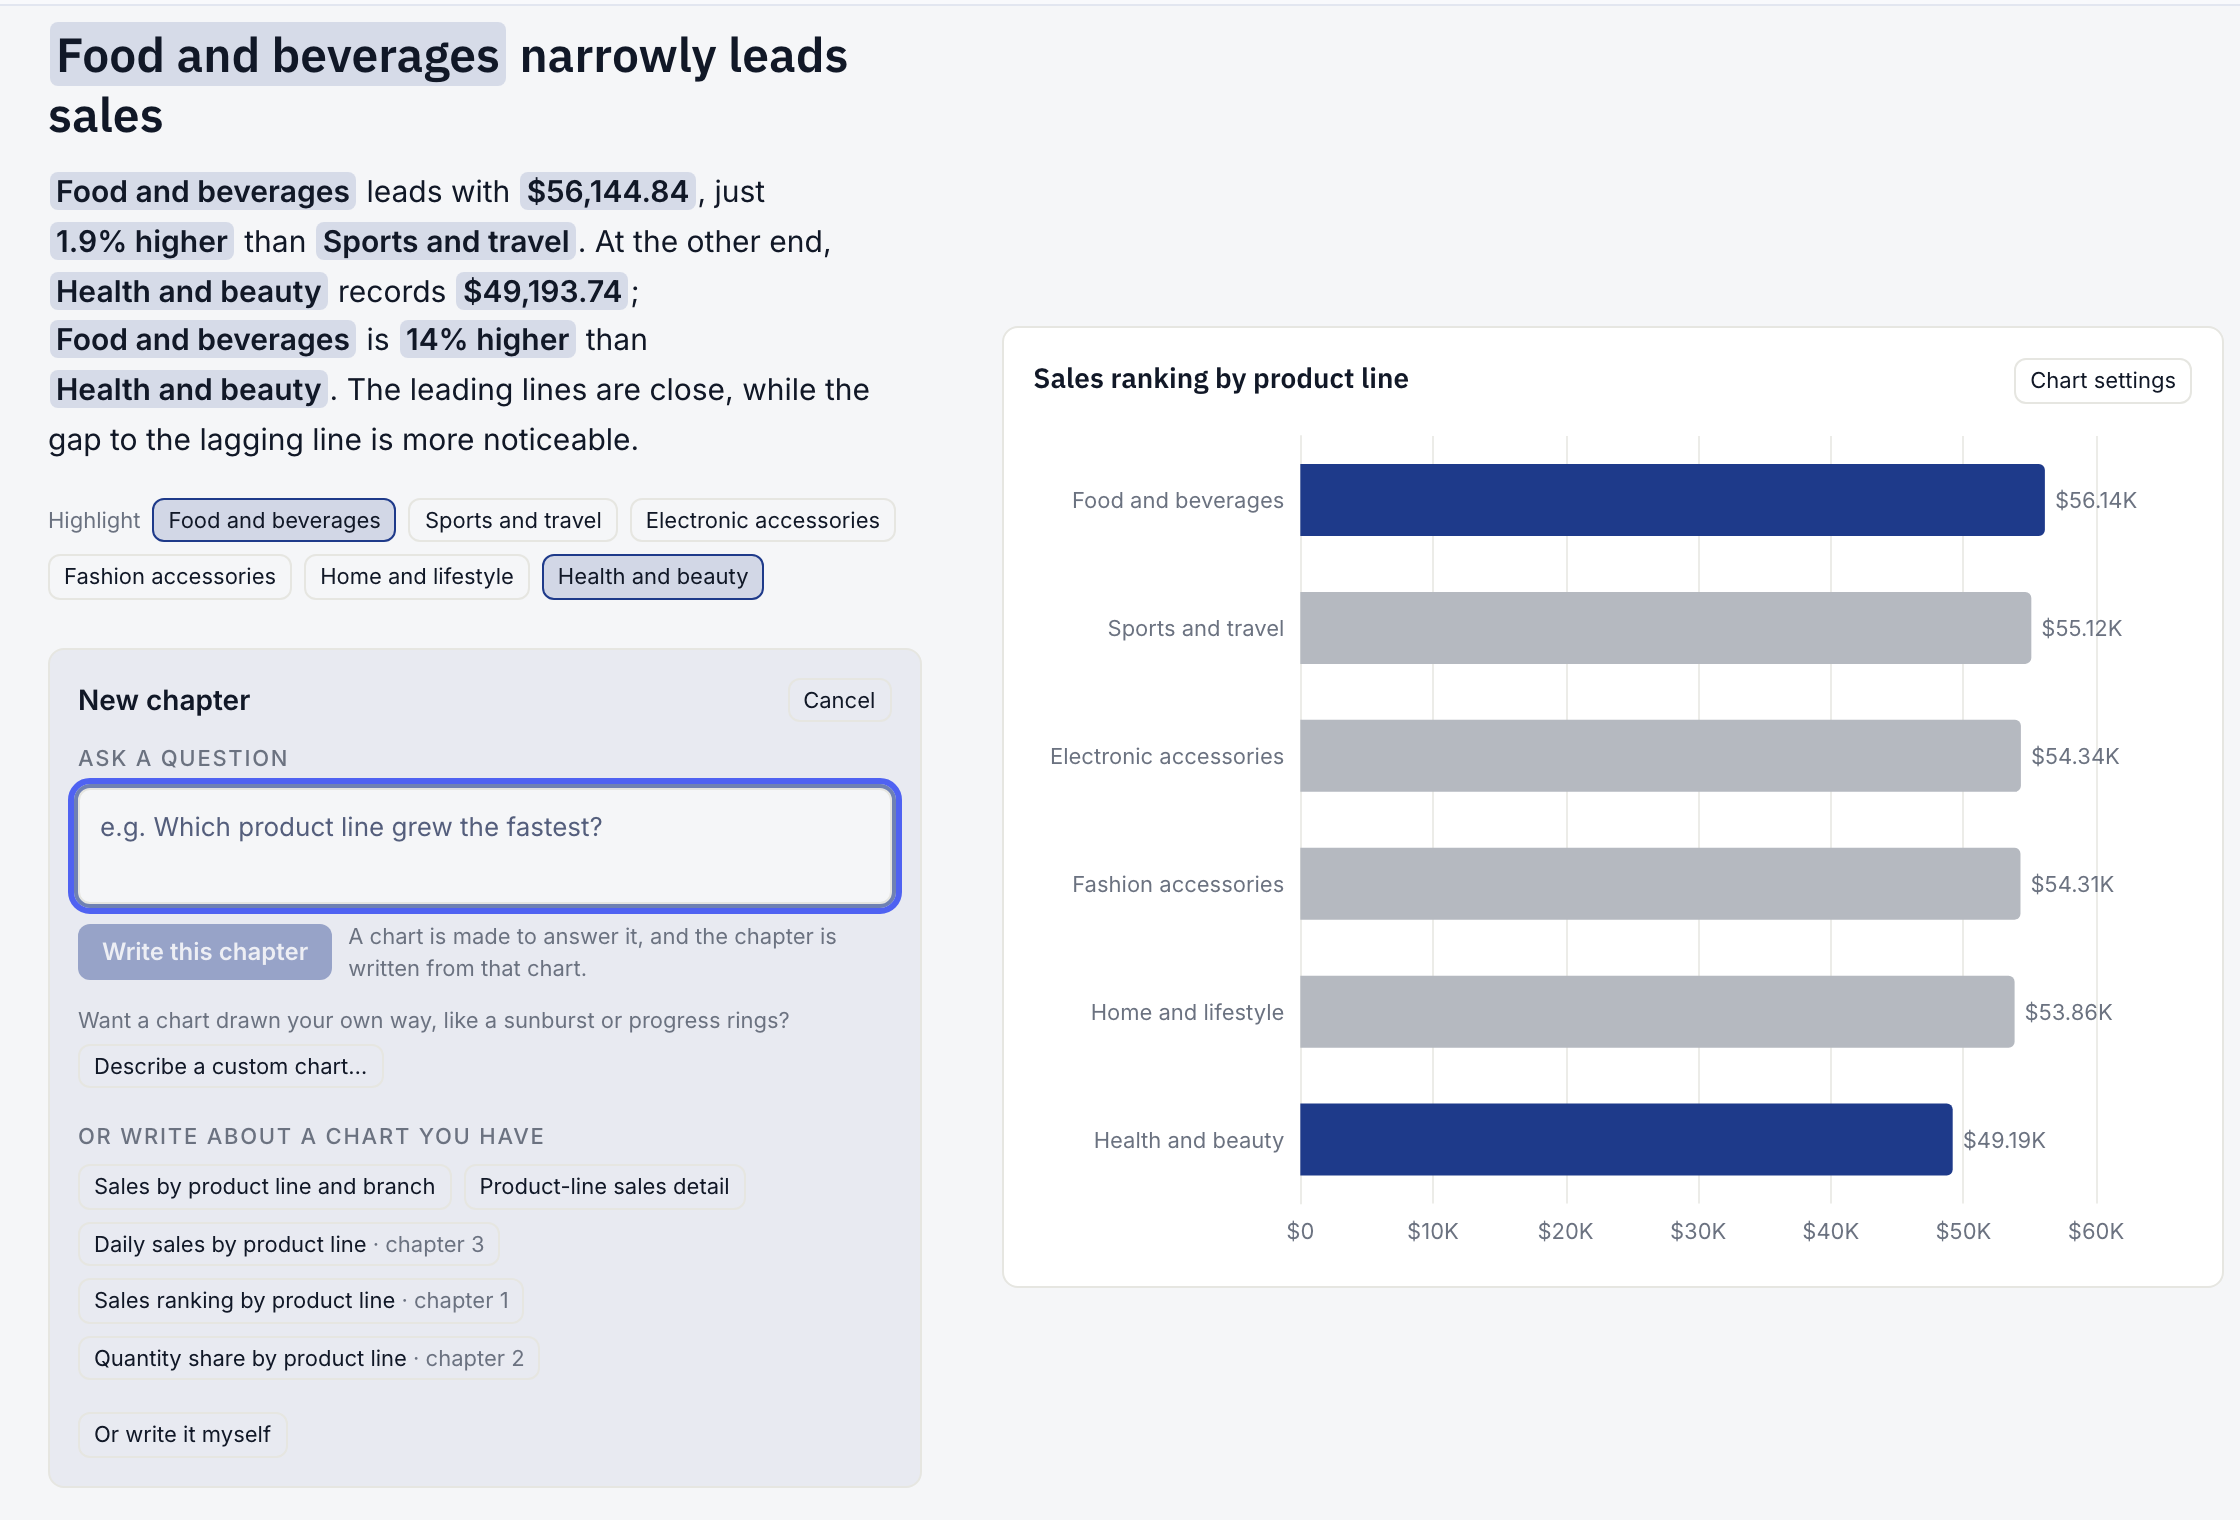
Step 5 is where AI-written reports usually go wrong, because a language model can write a plausible number that isn't in the data. In this story the model never types a figure. It writes the sentence with placeholders, and the figures are filled in from the chart's data:
{top} leads with {top_value}, just {top_over_second} than {second}.
becomes
"Food and beverages leads with $56,144.84, just 1.9% higher than Sports and travel."
Checked against the raw file, food and beverages totals $56,144.84 and sports and travel $55,122.83, a 1.85% gap that rounds to 1.9%. Because the figures come from the data, they also update when the data refreshes, and the chapter can't quietly keep an old number.
What the first draft missed
Every number in that story is correct, and it still misses something. "Health and beauty is lowest" is true of total sales. It isn't true of order size.
A box plot of sales per order shows health and beauty has the highest median order of the six lines ($272.31), while food and beverages, the sales leader, has the second lowest ($252.49). Health and beauty's total is low because it had the fewest orders (152, against 174 for food and beverages), not because its customers spend less per visit. For a store manager deciding whether to cut shelf space, that changes the conclusion. The box plot guide walks through the numbers.
This is the most useful habit in data storytelling: once the draft is written, ask what would make its headline wrong. Totals hide counts. Averages hide spread. A ranking hides how close the gaps are. Add a chapter for the qualifier rather than dropping it, because it's usually the most useful thing you can tell the reader.
Common data storytelling mistakes
- Step 1Topic headings'Sales by region' says what the chart is; 'The West drove two-thirds of the decline' says what it means.
- Step 2Too many chartsif a chart doesn't support a sentence in the story, cut it.
- Step 3Numbers in the text that don't match the chartrecalculate before you send it.
- Step 4No audiencea story for the CFO and one for store managers should use different detail and words.
- Step 5No endingfinish with what to do next, not a summary of what you already said.
- Step 6Hiding the caveatssay what period the data covers and what it can't show.
Tools for data storytelling
You can tell a data story in slides, a written report, or an annotated dashboard. What matters is the order and the claim on each chart. Scrolling stories, where the chart stays pinned while the text moves past it, work well for reports that get read on screen and shared as a link.
In Better Analyst, the Data story mode builds the charts, orders them, writes a chapter for each and checks the numbers, then lets you edit the text, add a figure by typing @, add chapters from a question, and share the story with a link. You can also make a story from a dashboard built from uploaded files, or a dashboard from a story, as a copy that leaves the original as it is.
Turn a spreadsheet into a data story
Attach your data, say what you want explained and who will read it, and get a scrolling story with every figure filled in from your data.
No credit card required. Free plan included.
Frequently asked questions
What are the three elements of data storytelling?
What is an example of data storytelling?
Is data storytelling the same as data visualization?
How long should a data story be?
Can AI write a data story?
What's the difference between a data story and a dashboard?
How to Make a Box Plot: By Hand, in Excel, in Google Sheets, or With AI
Make a box plot step by step by hand, in Excel or in Google Sheets, or with AI. Worked on 1,000 real orders, with why tools give different quartiles.
Read moreThe 7 Best Data Visualization Tools in 2026
A practical comparison of data visualization tools, from AI chart makers to enterprise BI, with pricing, strengths, and who each one is for.
Read moreThe 8 Best Power BI Alternatives and Competitors in 2026
Power BI alternatives by the reason you're leaving, with license costs at 10, 25 and 100 people, when to stay, and how to add AI without migrating.
Read more