How to Make a Box Plot: By Hand, in Excel, in Google Sheets, or With AI
The five numbers behind every box plot, how to draw one in each tool, and a worked example on 1,000 supermarket orders that shows what a bar chart of totals hides.

Summary
To make a box plot, sort the values and find five numbers: the minimum, first quartile, median, third quartile and maximum. Draw a box from the first to the third quartile with a line at the median, run whiskers to the furthest values within 1.5 times the box's length, and mark anything beyond as an outlier. Excel, Google Sheets and AI tools can draw it from raw data.
On this page
The short answer
Sort the values, find the minimum, first quartile, median, third quartile and maximum, then draw a box from Q1 to Q3 with a line at the median. Whiskers reach the furthest values within 1.5 × the interquartile range, and anything beyond is an outlier. In Excel, use Insert > Insert Statistic Chart > Box and Whisker; in Google Sheets, Insert > Chart and pick Box and whisker chart.
What a box plot shows
A box plot (also called a box and whisker plot) squeezes a column of numbers into one picture of its spread. John Tukey introduced it in the 1970s as a quick way to compare groups without plotting every point.
Each box has five parts:
- The box runs from the first quartile (Q1) to the third quartile (Q3). Half of all values sit inside it. Its length is the interquartile range, or IQR.
- The line inside the box is the median: half the values are below it and half above.
- The whiskers reach out to the lowest and highest values that are within 1.5 × IQR of the box.
- The dots beyond the whiskers are outliers: values unusually far from the rest.
- A marker for the mean is optional. When the mean sits well above the median, a few large values are pulling the average up.
Box plots earn their place when you compare groups. A bar chart of averages tells you one number per group. A row of box plots tells you the typical value, how spread out the values are, and whether a few extreme values are distorting the picture.
How to make a box plot by hand
Here are 11 real order values (in dollars) from the health and beauty aisle of one supermarket branch, taken from the sample file used throughout this guide:
549, 489, 76, 749, 507, 235, 203, 753, 167, 19, 273
- Sort the values. 19, 76, 167, 203, 235, 273, 489, 507, 549, 749, 753.
- Find the median. With 11 values, the median is the 6th: 273.
- Find the quartiles. The textbook method takes the median of each half, leaving out the overall median. The lower half (19, 76, 167, 203, 235) gives Q1 = 167. The upper half (489, 507, 549, 749, 753) gives Q3 = 549.
- Work out the IQR. 549 − 167 = 382.
- Set the fences. 1.5 × 382 = 573, so the fences are 167 − 573 = −406 and 549 + 573 = 1,122. No value falls outside them, so this set has no outliers and the whiskers run to the minimum (19) and maximum (753).
- Draw it. Draw a number line, a box from 167 to 549, a line at 273, and whiskers out to 19 and 753.
Notice the median sits much closer to the bottom of the box than the top. That tells you the bigger orders are more spread out than the small ones, which is typical for order values.
Why tools give different quartiles
Run the same 11 values through Excel and you can get a different box. =QUARTILE.EXC(range,1) returns 167 and =QUARTILE.EXC(range,3) returns 549, matching the hand method. =QUARTILE.INC(range,1) returns 185 and =QUARTILE.INC(range,3) returns 528, because the inclusive method interpolates between neighbouring values instead.
Neither is wrong. They are two of several accepted definitions. Excel's box and whisker chart and Google Sheets' box and whisker chart both let you pick an inclusive or exclusive median method. On small data, pick one method and say which you used. On hundreds of rows the gap shrinks: for the 152 health and beauty orders in the next example, Q3 is $492.72 by the inclusive method and $500.07 by the exclusive one, about 1.5% apart.
Worked example: 1,000 supermarket orders
The rest of this guide uses the supermarket sales sample file that comes with Better Analyst: 1,000 orders across six product lines, one row per order, with a Sales column for each order's value. Here are the box plot numbers for sales per order, using the inclusive method:
| Product line | Orders | Median | Box (Q1 to Q3) | Lowest to highest | Outliers |
|---|---|---|---|---|---|
| Health and beauty | 152 | $272.31 | $125.67 to $492.72 | $18.64 to $950.25 | 0 |
| Sports and travel | 166 | $270.93 | $133.26 to $477.68 | $10.68 to $1,002.12 | 1 |
| Home and lifestyle | 160 | $258.19 | $126.08 to $491.76 | $14.68 to $1,023.75 | 0 |
| Food and beverages | 174 | $252.49 | $134.90 to $452.65 | $22.66 to $1,034.46 | 5 |
| Electronic accessories | 170 | $241.22 | $118.50 to $475.82 | $26.72 to $942.45 | 0 |
| Fashion accessories | 178 | $211.65 | $106.16 to $442.69 | $12.69 to $1,042.65 | 3 |
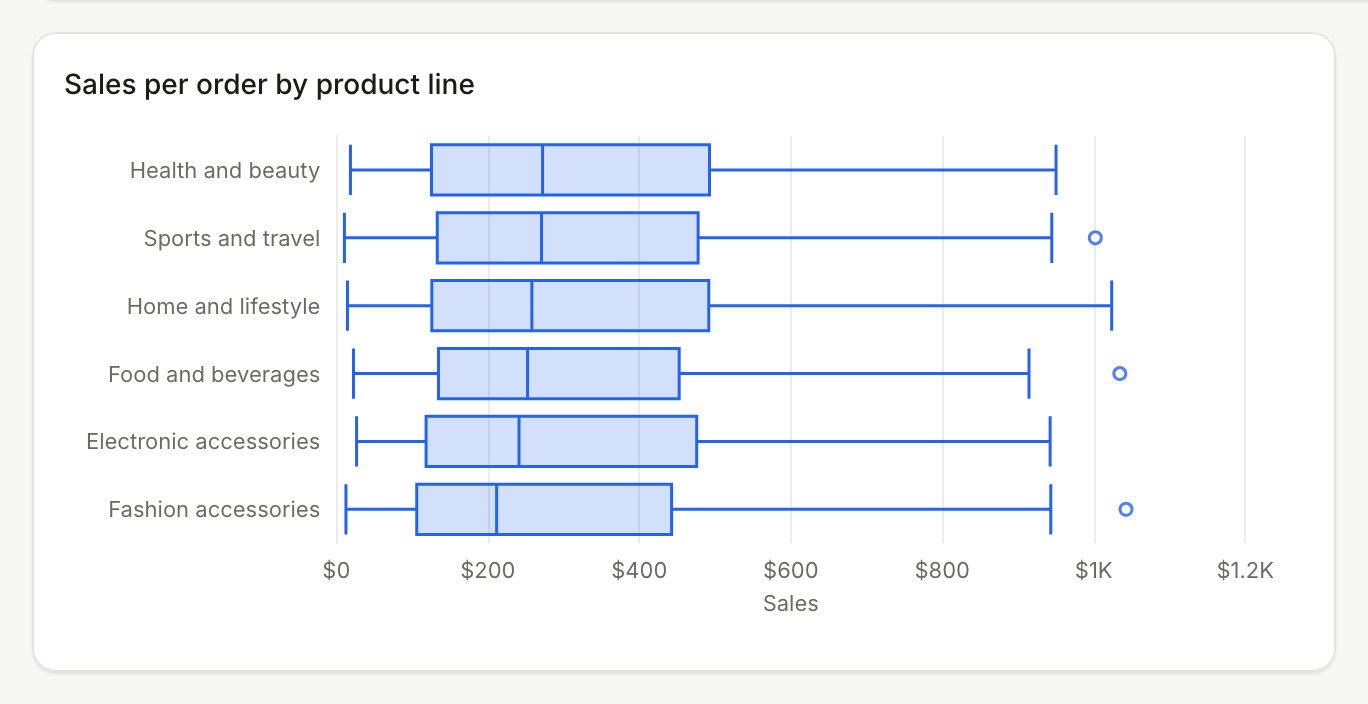
Now compare that with total sales. Food and beverages has the highest total of the six lines ($56,144.84) and health and beauty the lowest ($49,193.74). A bar chart of totals would crown food and beverages and put health and beauty last.
The box plot tells a different story. Health and beauty has the highest typical order, with a median of $272.31, and food and beverages has the second lowest, at $252.49. Health and beauty's total is low because it had the fewest orders (152, against 174 for food and beverages), not because its orders are small. Food and beverages also has the most outliers: five unusually large orders above the upper fence of about $929.
That's the kind of thing a box plot is for. Totals mix up how many orders a group had with how big they were; the box plot separates the two.
How to make a box plot in Excel
Box and whisker charts are built into Excel for Microsoft 365, Excel 2024, 2021, 2019 and 2016, and into the Mac versions of Microsoft 365, 2024 and 2021.
- Put your values in a column. For several groups, use one column per group, or a label column next to a value column.
- Select the data.
- On Windows, go to Insert > Insert Statistic Chart > Box and Whisker. On a Mac, open the Insert tab, select the statistical chart icon, and choose Box and Whisker.
- Right-click a box and select Format Data Series to change the options: Show inner points, Show outlier points, Show mean markers, Show mean line, and Quartile Calculation, which offers Inclusive median or Exclusive median.
If you need the numbers as well as the picture, put QUARTILE.INC or QUARTILE.EXC, MEDIAN, MIN and MAX next to the chart, using the same method as the chart.
How to make a box plot in Google Sheets
Google Sheets added a native box and whisker chart in October 2026. Many tutorials still describe the older candlestick workaround, which you no longer need for raw data.
- Put optional group labels in the first column and numbers in the columns after it. Each column (or group) becomes its own box.
- Select the cells.
- Go to Insert > Chart.
- In the chart editor, open Setup, scroll the Chart type list to Statistical, and pick Box and whisker chart.
- Under Customize > Series, you can show outlier points, a mean marker and a mean line, and choose the quartile calculation.
Google says the rollout started on October 22, 2026, and on November 6, 2026 for Scheduled Release domains, each taking up to 15 days. If you don't see the chart type yet, use a candlestick chart built from pre-calculated minimum, quartile and maximum values in the meantime. Box and whisker charts in Excel files now survive the import into Sheets too.
How to make a box plot with AI
Spreadsheet charts work on one sheet you've already shaped. An AI data tool can start from the raw file, do the grouping for you, and keep the chart on a dashboard that refreshes.
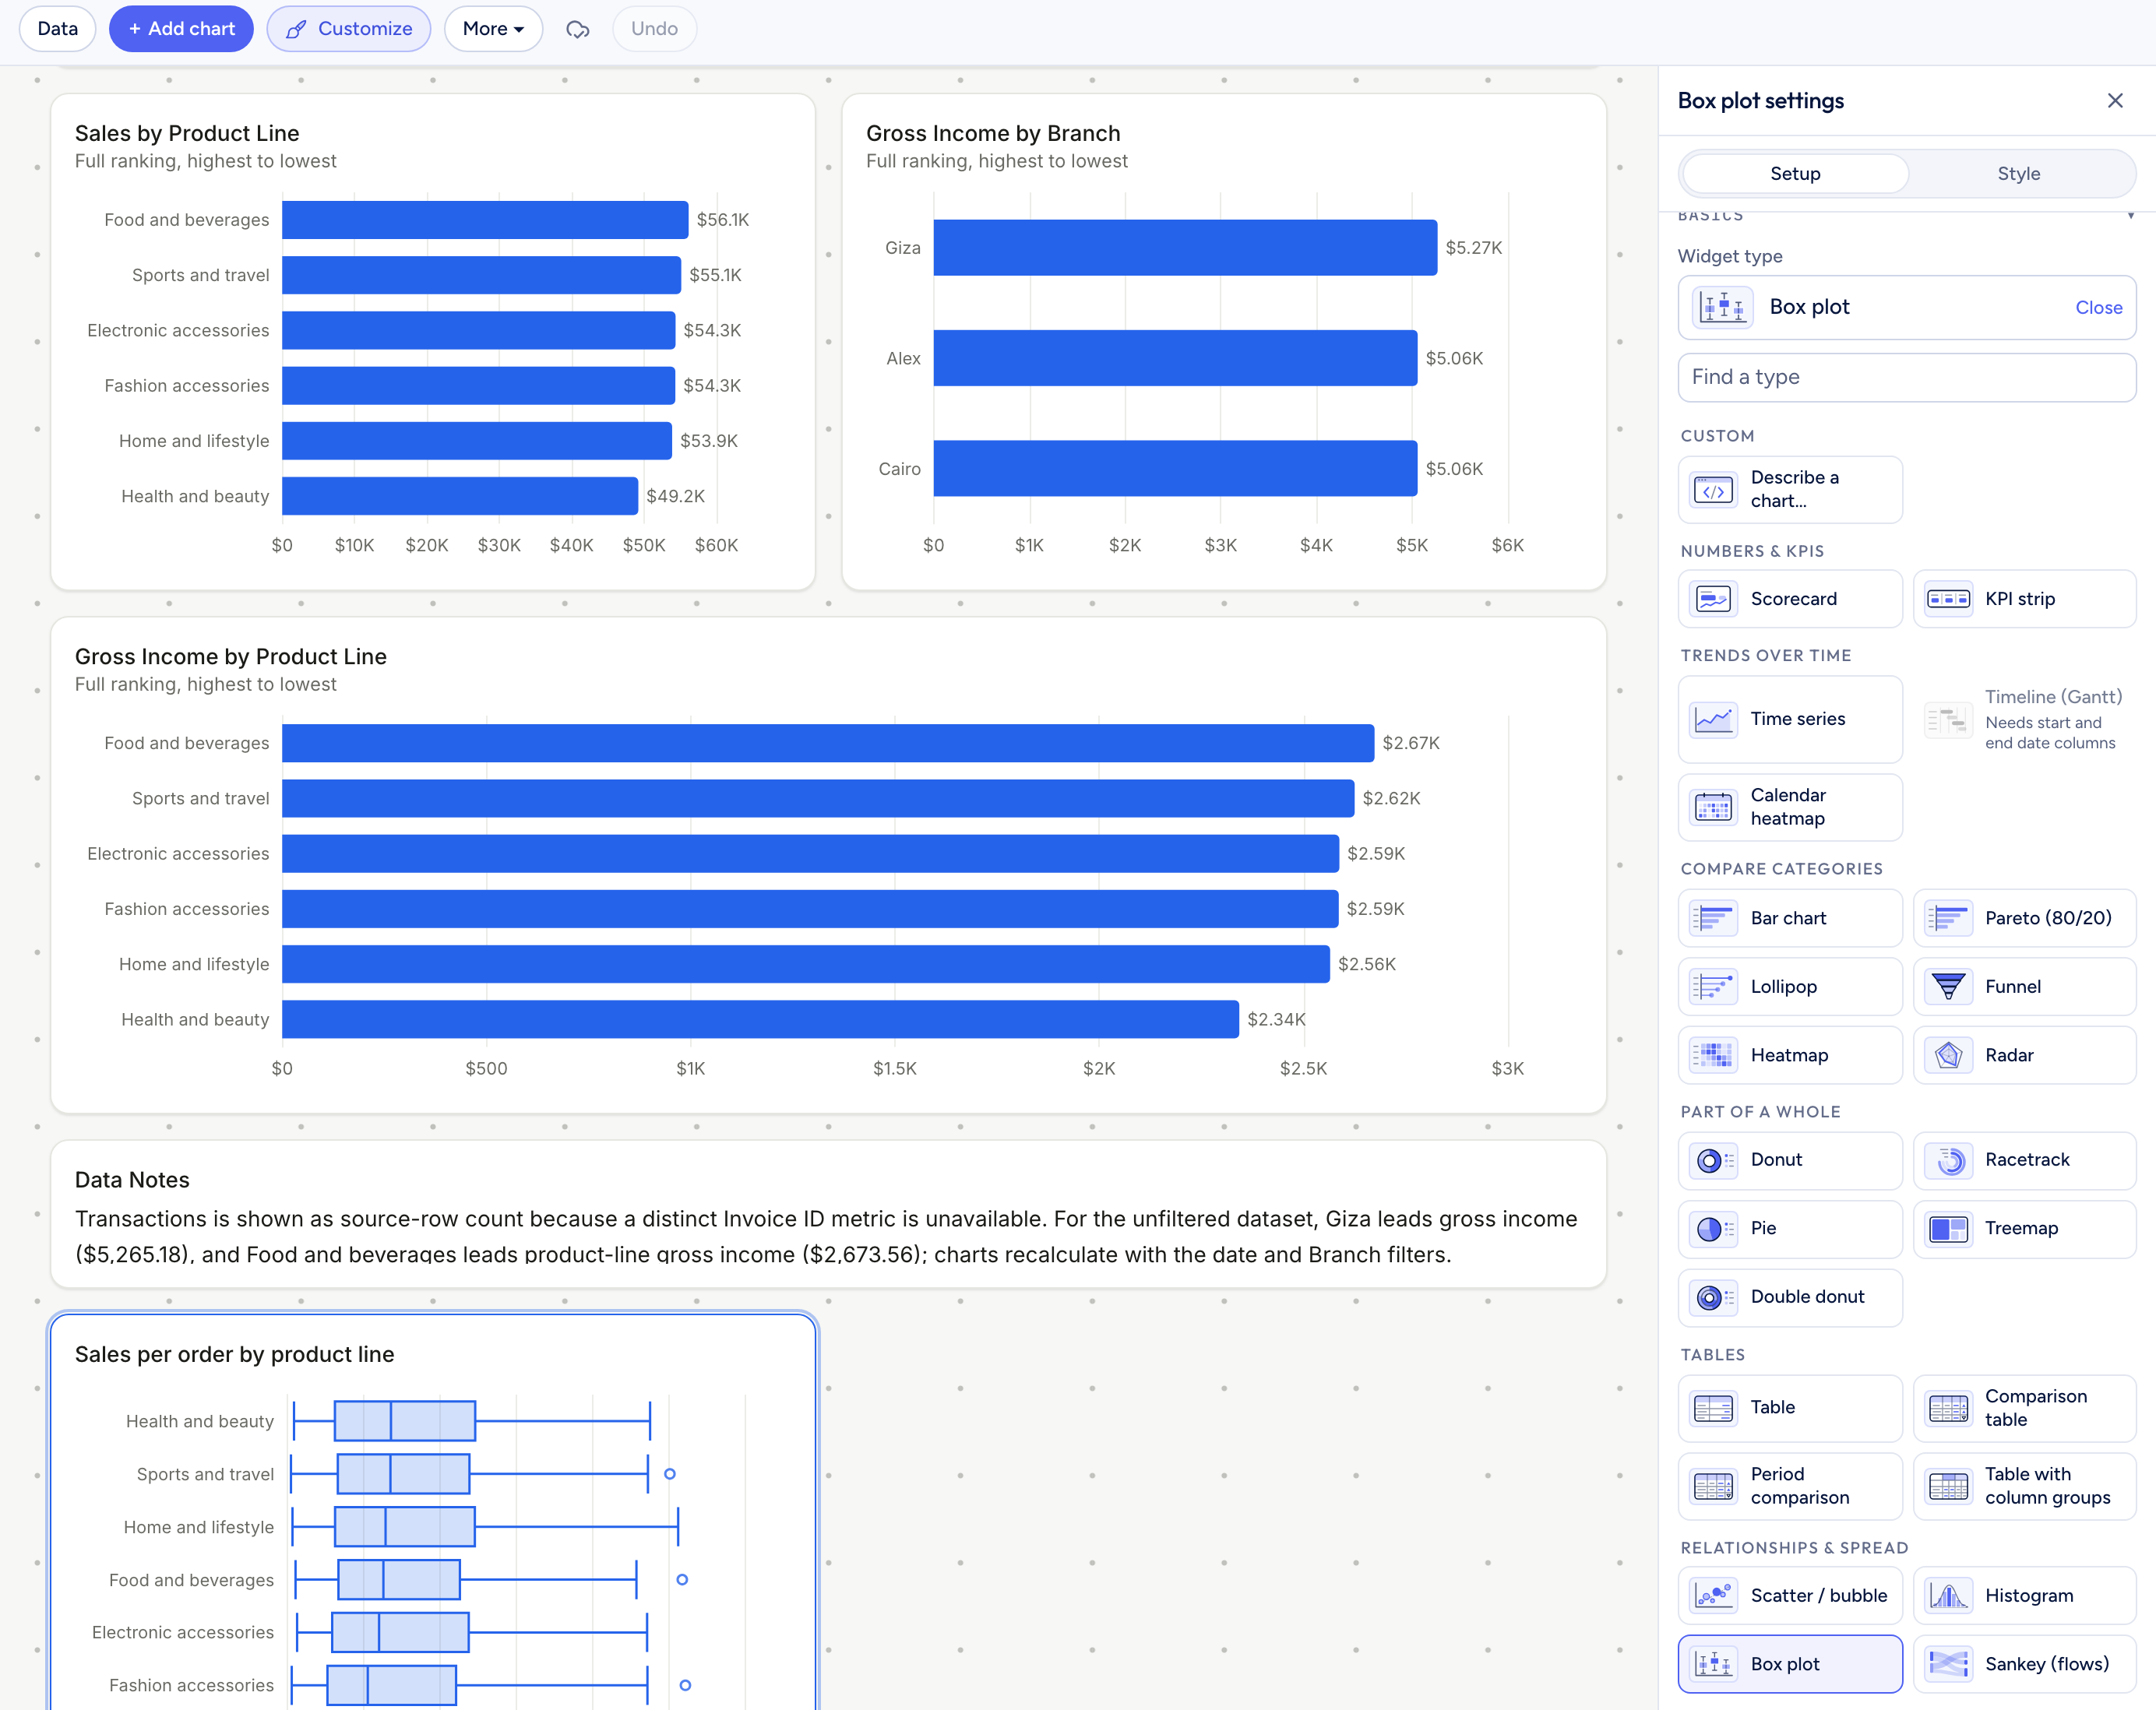
In Better Analyst, the box plot is a dashboard chart type. The box plot above was made this way from the sample file:
- Build a dashboard from your file: attach it in a chat and ask for a dashboard, for example "Build a sales dashboard by product line."
- Open the dashboard, select Edit, then Add chart.
- Pick Box plot from the Relationships & spread group.
- Set Value to the number to measure (here, Sales), Group to the column to split by (Product line), and turn on Horizontal if the group names are long.
The chart computes the quartiles with the inclusive method, sorts boxes by median, and shows the median, quartiles, whiskers and count when you hover over a box. Dots mark only the lowest and highest values beyond the whiskers, so food and beverages shows one dot for its five outliers. The settings are explained in the box plot docs.
Pick the right level before you plot
The most common box plot mistake isn't the quartile method. It's plotting the wrong unit.
The sample file has one row per order, so the box plot above shows the spread of order values. Group the same rows into daily totals per product line and the picture changes: electronic accessories now has the highest median day ($657.51) and health and beauty the lowest ($544.18), nearly the reverse of the per-order ranking.
Both charts are correct. They answer different questions: "How big is a typical order?" versus "How big is a typical day?" Decide which question you're asking, then make sure each value in the column is one of those units. In Better Analyst, the box plot's Per setting does this grouping for you, for example revenue per customer instead of revenue per order.
When to use a box plot
- Step 1Comparing groupsorder value by region, delivery time by carrier, salary by department.
- Step 2Spotting outliersa few unusually large refunds or slow tickets.
- Step 3Checking skewthe median sitting low in the box means a long tail of large values.
- Step 4Not for one distribution's shapeuse a histogram when you need to see peaks or gaps.
- Step 5Not for tiny groupswith fewer than about 10 values per group, show the points instead.
For an Excel walkthrough focused on flagging unusual orders, see how to find unusual orders with a box plot. For more chart types and when each one fits, see types of charts and graphs. If you're turning results like these into a narrative for other people, see data storytelling.
Turn a spreadsheet into a box plot
Upload your file, build a dashboard, and add a box plot that compares any value across groups.
No credit card required. Free plan included.
Frequently asked questions
What are the five numbers in a box plot?
How do you find outliers for a box plot?
Why do Excel, Google Sheets and my textbook give different quartiles?
Can Google Sheets make a box plot?
When should I use a box plot instead of a histogram?
Data Storytelling: What It Is, How to Do It, and a Worked Example
What data storytelling is, how to build a data story in six steps, and a worked example from 1,000 real orders, including what the first draft missed.
Read moreHow to Find Unusual Orders with a Box Plot
Read more33 Types of Charts and Graphs: Examples and When to Use Each
Compare 33 chart and graph types, see practical examples, and learn which visualization fits your data.
Read more