The 7 Best Analytics Software Tools in 2026
Most teams do not need another dashboard tool. They need answers from the data they already have, delivered to the people who need them. Here is how the leading analytics software compares.
 By Better Analyst12 min read
Disclosure: Better Analyst publishes this blog and makes the first tool on this list. We judged every tool on the same criteria and list the trade-offs for each, including our own.
On this page
The short answer
Better Analyst is the best analytics software for most small teams and growing businesses: ask questions in plain English, get analysis calculated in real code, and share results as dashboards, reports, or Slack messages on a schedule. Pick Metabase or Hex if you have SQL-savvy analysts, Google Analytics 4 or Mixpanel for web and product behavior, and Tableau or Power BI only if you are a large enterprise with a BI team and budget.
Top picks at a glance
| # | Tool | Best for | Starting price |
|---|---|---|---|
| 1 | Better Analyst | AI analysis, dashboards, and automated reporting | Free; Starter $20/mo |
| 2 | Looker Studio | Free reporting on Google data | Free; Pro $9/user/project/mo |
| 3 | Metabase | Self-serve dashboards on a SQL database | Free (self-hosted); cloud from $100/mo |
| 4 | Hex | Data teams working in SQL and Python notebooks | Free; Professional $36/editor/mo |
| 5 | Google Analytics 4 | Website and app traffic | Free |
| 6 | Mixpanel | Product usage and funnels | Free up to 1M events/mo |
| 7 | Tableau & Power BI | Large enterprises with BI teams | Enterprise licensing |
Prices are published list prices as of October 2026 and may change.
How we chose
Analytics software is a broad category, so we focused on what a small or growing team needs to go from data to decisions, based on each vendor’s published features and pricing:
- Who can use it: can someone without SQL get a trustworthy answer?
- Data coverage: spreadsheets, databases, warehouses, and business apps.
- Trust: does it show the query or code behind each number?
- Delivery: dashboards, scheduled reports, and sharing where people already work.
- Total cost: licenses plus setup, training, and maintenance time.
The 7 best analytics software tools
Better Analyst
Our pickAn AI data analyst for the whole team. Ask a question about any connected data source and get a calculated answer, chart, or dashboard, then automate it so the answer keeps arriving.
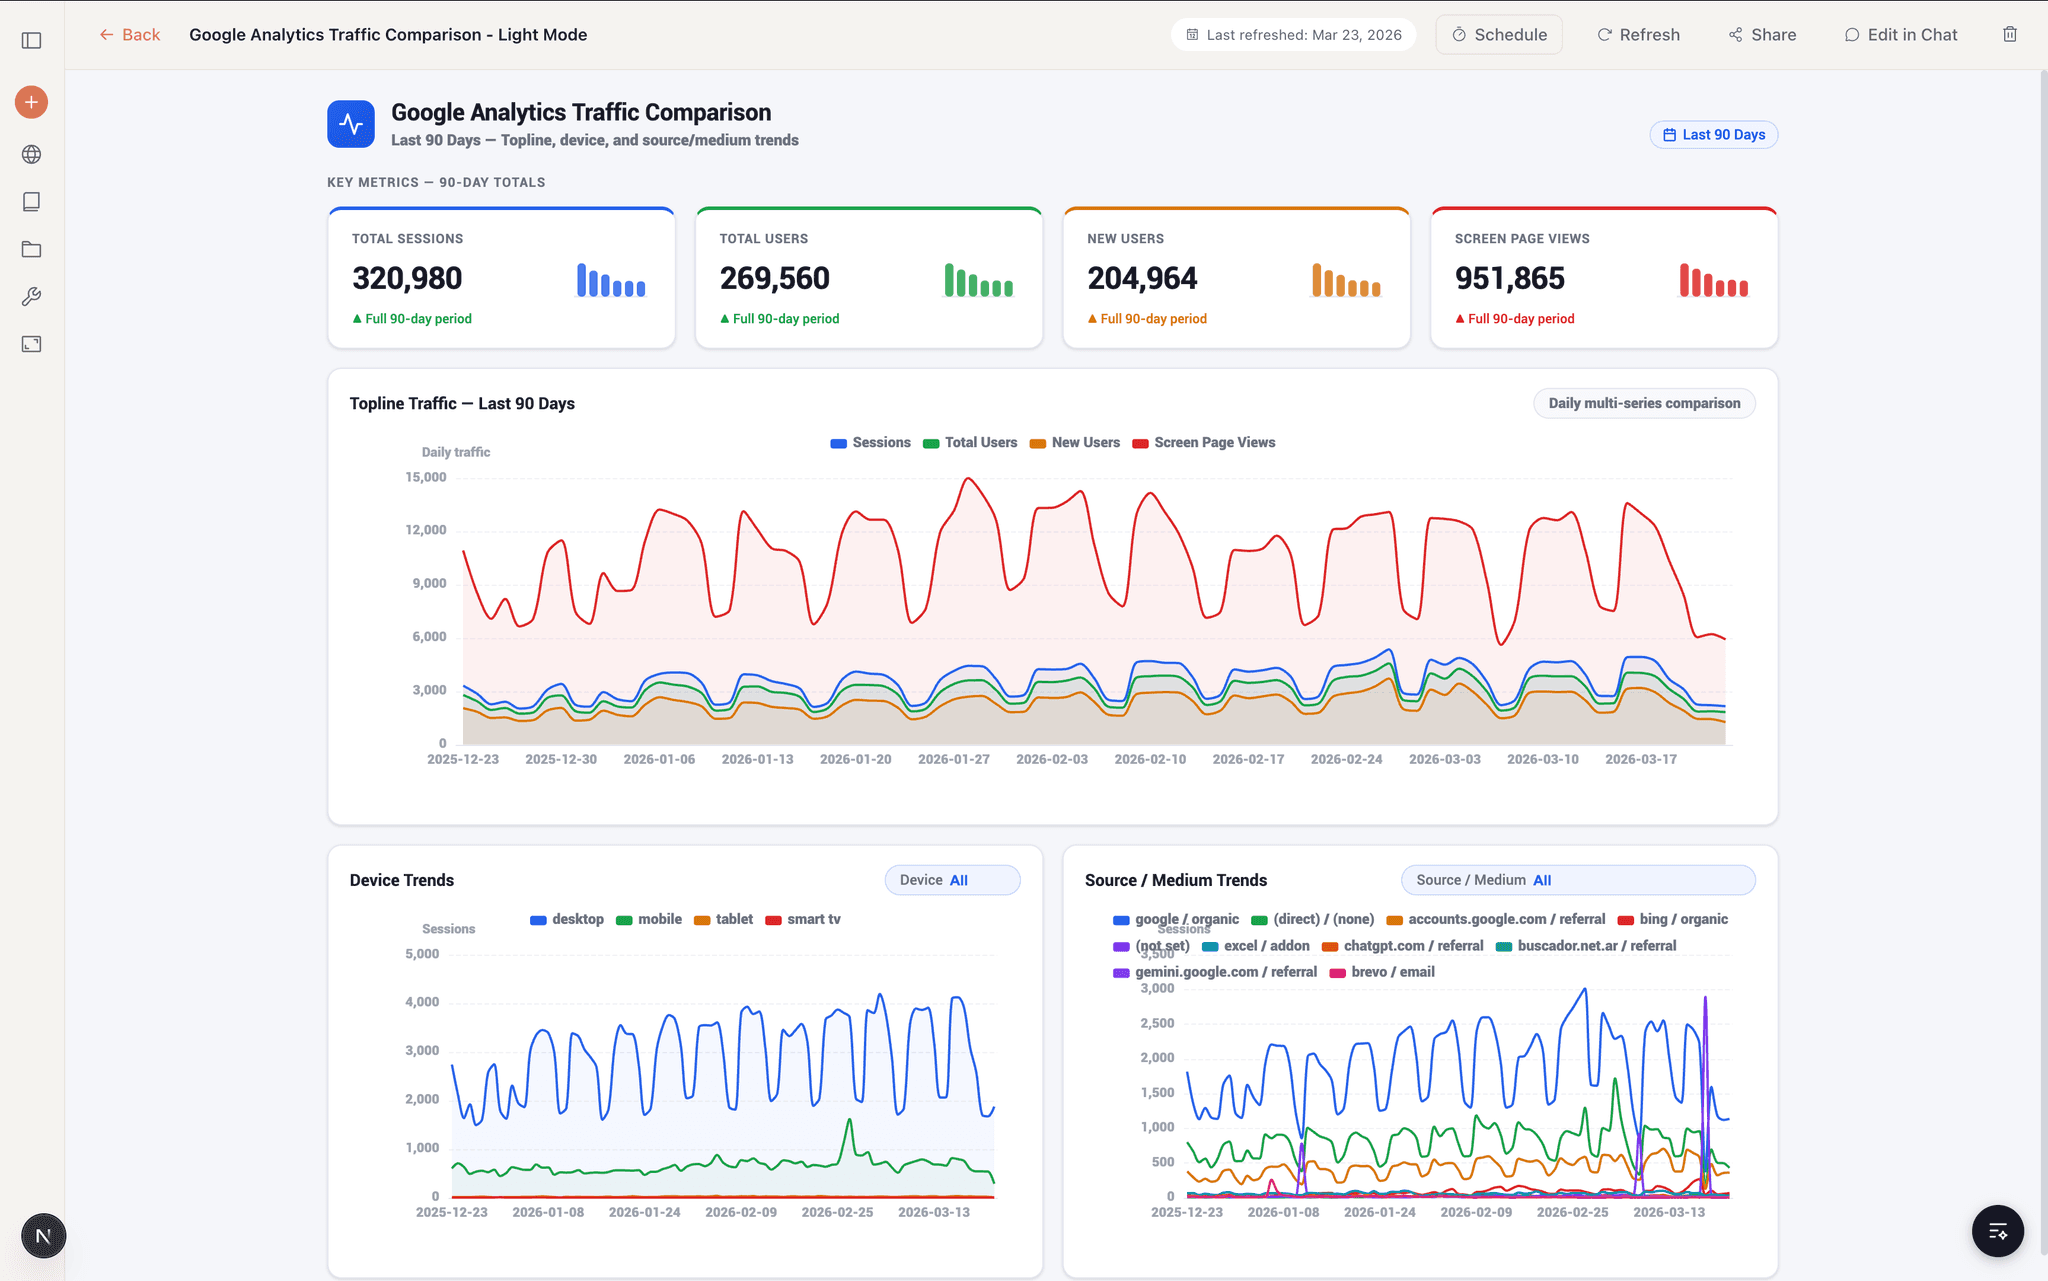
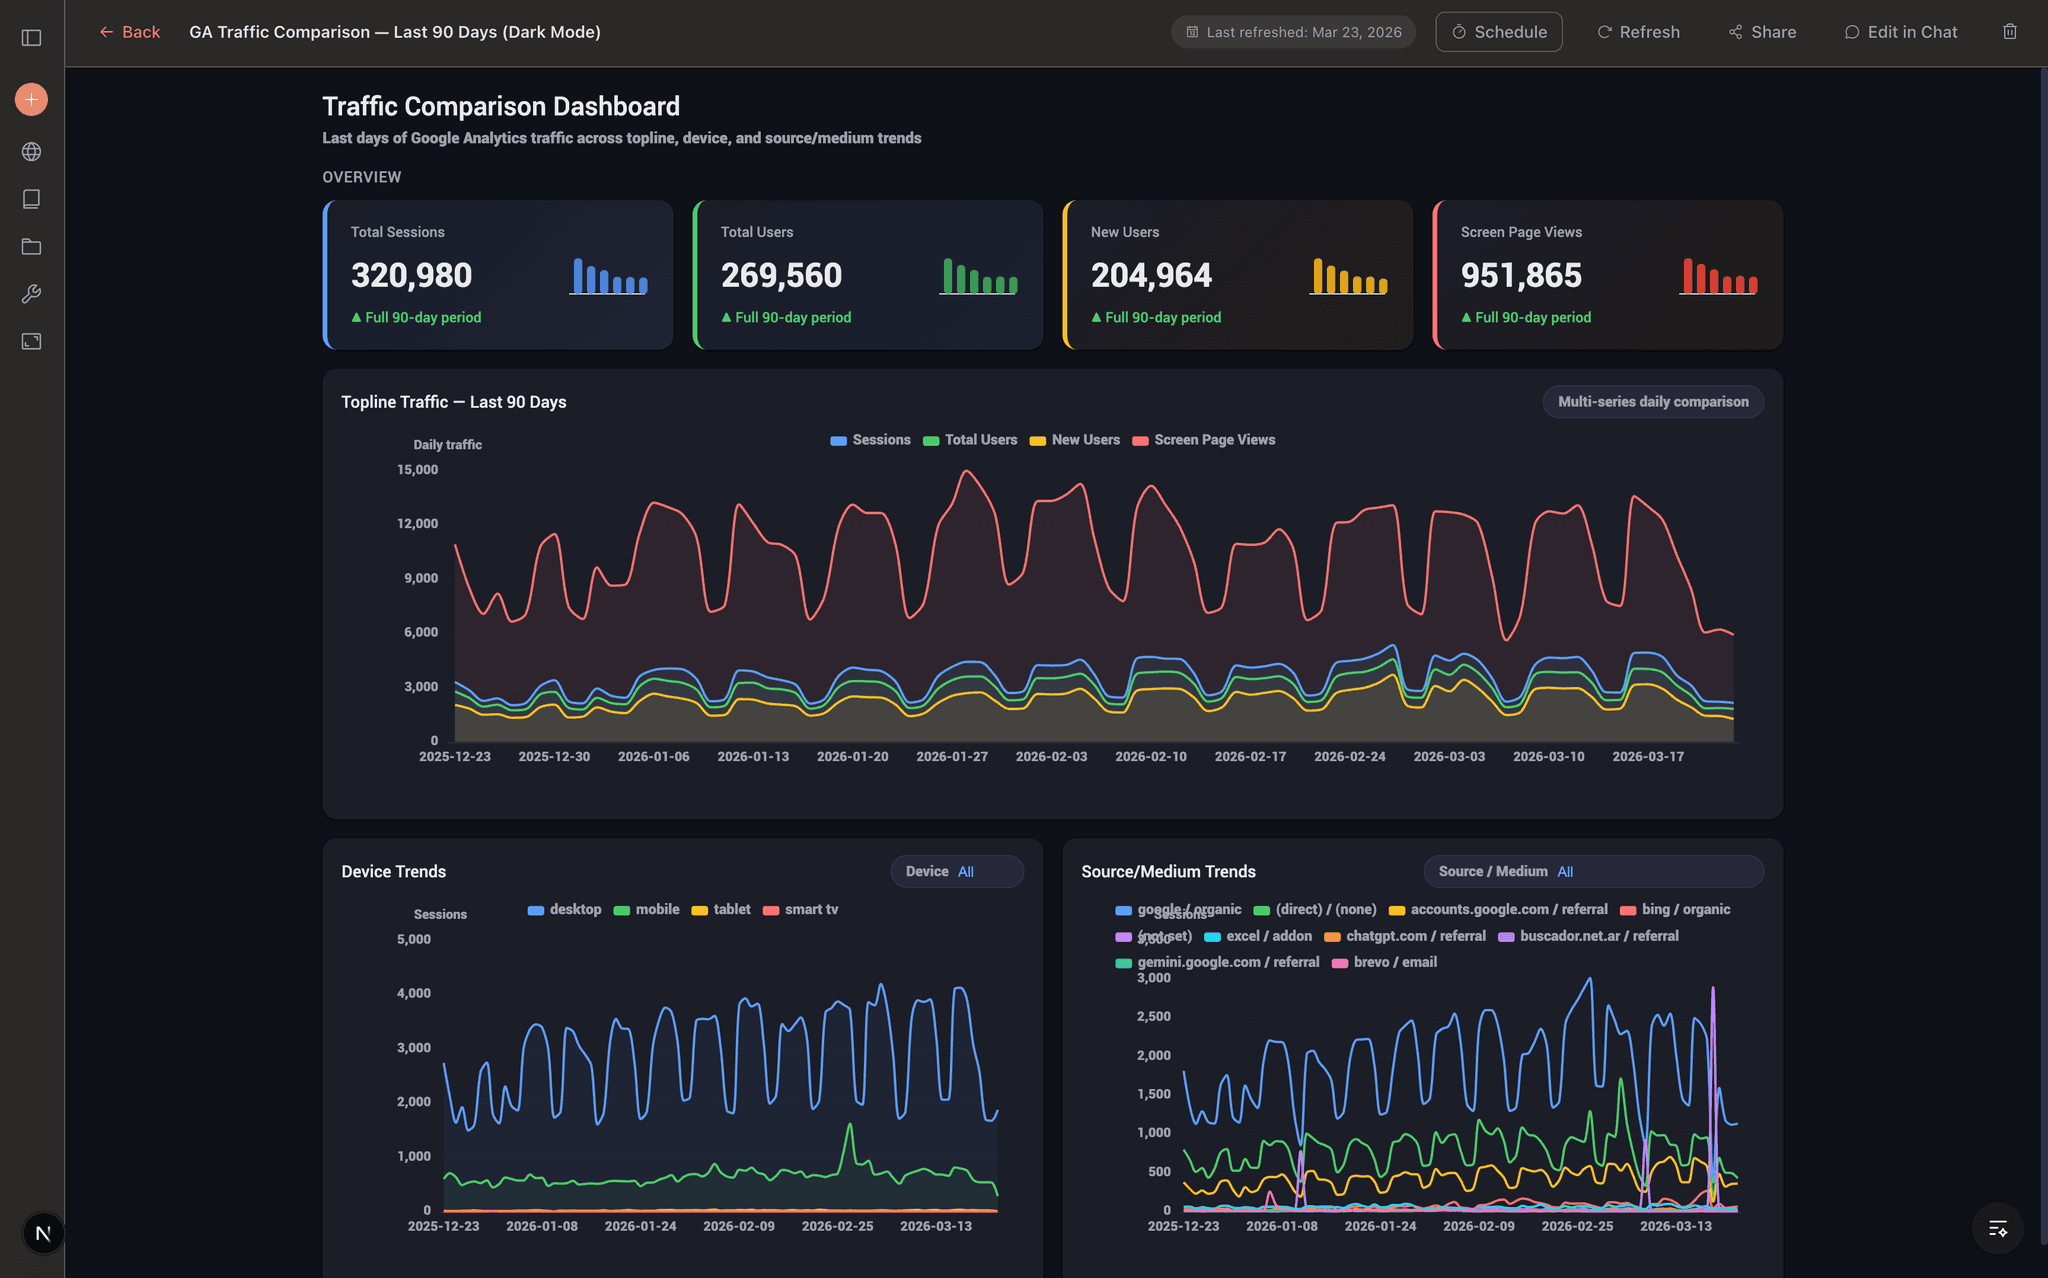
Better Analyst replaces the loop of exporting data, building a pivot, and pasting charts into a deck. Chat with Data answers questions against your spreadsheets and connected databases, while Data Context teaches the AI what your tables and metrics mean.
When an answer matters every week, save it as a scheduled task, publish it as a dashboard, or have the Slack Agent post it to a channel.
- Best for
- Small teams and growing businesses without a dedicated data team
- Pricing
- Free plan included. Starter $20/mo, or $14/mo billed yearly. Max $40/seat and Business $80/seat for teams.
What we like
- Chat with your data in plain English; every answer is calculated with SQL or Python you can inspect
- Connects to PostgreSQL, MySQL, SQL Server, BigQuery, Snowflake, Supabase, Google Analytics, and Search Console
- Data Context lets you define approved tables, metrics, and relationships so answers stay consistent
- Dashboards, slides, and scheduled tasks that re-run analysis and deliver results
- Slack Agent answers data questions in threads and posts scheduled reports (beta)
Watch out for
- Newer than legacy BI suites, so some enterprise governance features are still expanding
- Data Flows and the Slack Agent are in beta
Looker Studio
Free, shareable reports that work best on Google data like Analytics, Ads, Sheets, and BigQuery.
- Best for
- Marketing reporting on Google sources
- Pricing
- Free. Looker Studio Pro is $9 per user, per project, per month.
What we like
- Free with native Google connectors
- Simple link sharing
- Many community templates
Watch out for
- Reports are built by hand, chart by chart
- Blending and large data sources can be slow
- No AI analysis of open-ended questions
Metabase
A popular open-source BI tool for asking questions of a SQL database and building internal dashboards.
- Best for
- Startups with a database and someone comfortable with SQL
- Pricing
- Free open-source edition (self-hosted). Cloud Starter is $100/mo with 5 users included; Pro is $575/mo with 10 users.
What we like
- Free if you host it yourself
- Point-and-click query builder plus a SQL editor
- Good for internal dashboards
Watch out for
- Self-hosting means you own upgrades, backups, and security
- Best results still depend on SQL skills and clean data models
Hex
A collaborative notebook for data teams that mixes SQL, Python, and AI, then publishes results as apps.
- Best for
- Analysts and data scientists who write code
- Pricing
- Free Community plan. Professional is $36 per editor/mo; Team is $75 per editor/mo.
What we like
- Powerful notebooks with SQL and Python side by side
- Publish notebooks as interactive apps
- Strong collaboration features
Watch out for
- Built for technical users
- Compute and seat costs climb as the team grows
Google Analytics 4
The standard free tool for website and app traffic, acquisition, and conversions.
Better Analyst can connect to Google Analytics so you can ask questions about traffic in plain English and combine it with revenue data from your database.
- Best for
- Understanding website and app visitors
- Pricing
- Free. Google Analytics 360 is available for enterprises.
What we like
- Free and widely supported
- Deep integration with Google Ads
- Event-based tracking across web and apps
Watch out for
- Only covers web and app behavior, not the rest of your business data
- Reports and explorations have a learning curve
Mixpanel
Product analytics for understanding how users move through your app: funnels, retention, and feature adoption.
- Best for
- Product teams measuring in-app behavior
- Pricing
- Free up to 1 million events per month. Growth plans are priced by event volume.
What we like
- Excellent funnel and retention analysis
- Self-serve reports for product managers
- Generous free tier
Watch out for
- Requires event tracking to be instrumented in your product
- Focused on product usage rather than finance or operations data
Tableau & Power BI
Enterprise BI platforms for large organizations with dedicated BI developers, governed data models, and enterprise budgets.
For the enterprises they were designed for, both are proven choices. For a team that wants answers this week, the bigger cost is the setup: data modeling, training, and a backlog of dashboard requests waiting on a developer. AI-first analytics software like Better Analyst lets the people asking the questions get the answers themselves.
- Best for
- Large enterprises standardizing BI across many departments
- Pricing
- Enterprise licensing. Tableau Creator lists at $75/user/mo billed annually; Power BI needs a paid license for every viewer unless you buy capacity.
What we like
- Mature governance, security, and admin controls
- Large ecosystems and certified talent
Watch out for
- More expensive in practice once you add builder and viewer licenses, capacity, and the BI team to run them
- Dashboards usually need a trained developer to build and maintain
- Weeks of setup before most teams see value
How to choose analytics software
- Step 1List your questionsWrite down the five questions you ask most often. The right tool answers them with the least effort.
- Step 2Map your data sourcesMake sure the tool connects to where your data actually lives, from spreadsheets to warehouses.
- Step 3Decide who asksIf non-technical teammates need answers, favor plain-English analysis over SQL editors.
- Step 4Insist on showing the workChoose software that shows the query or code behind each number.
- Step 5Plan for deliveryScheduled reports, dashboards, and Slack delivery keep answers in front of people.
- Step 6Compare total costInclude viewer licenses, hosting, setup time, and the people needed to maintain it.
Get answers from your data today
Connect a spreadsheet, database, or app, ask a question in plain English, and share the answer as a chart, dashboard, or scheduled report.
No credit card required. Free plan included.
Frequently asked questions
Keep reading
More from the Better Analyst blog
The 7 Best Data Visualization Tools in 2026
A practical comparison of data visualization tools, from AI chart makers to enterprise BI, with pricing, strengths, and who each one is for.
Read moreThe 7 Best AI Tools for Excel in 2026
We compared the leading AI tools for Excel on formulas, analysis, charts, file support, and price. Here is which one fits your spreadsheet work.
Read more33 Types of Charts and Graphs: Examples and When to Use Each
Compare 33 chart and graph types, see practical examples, and learn which visualization fits your data.
Read more